01
Create your account
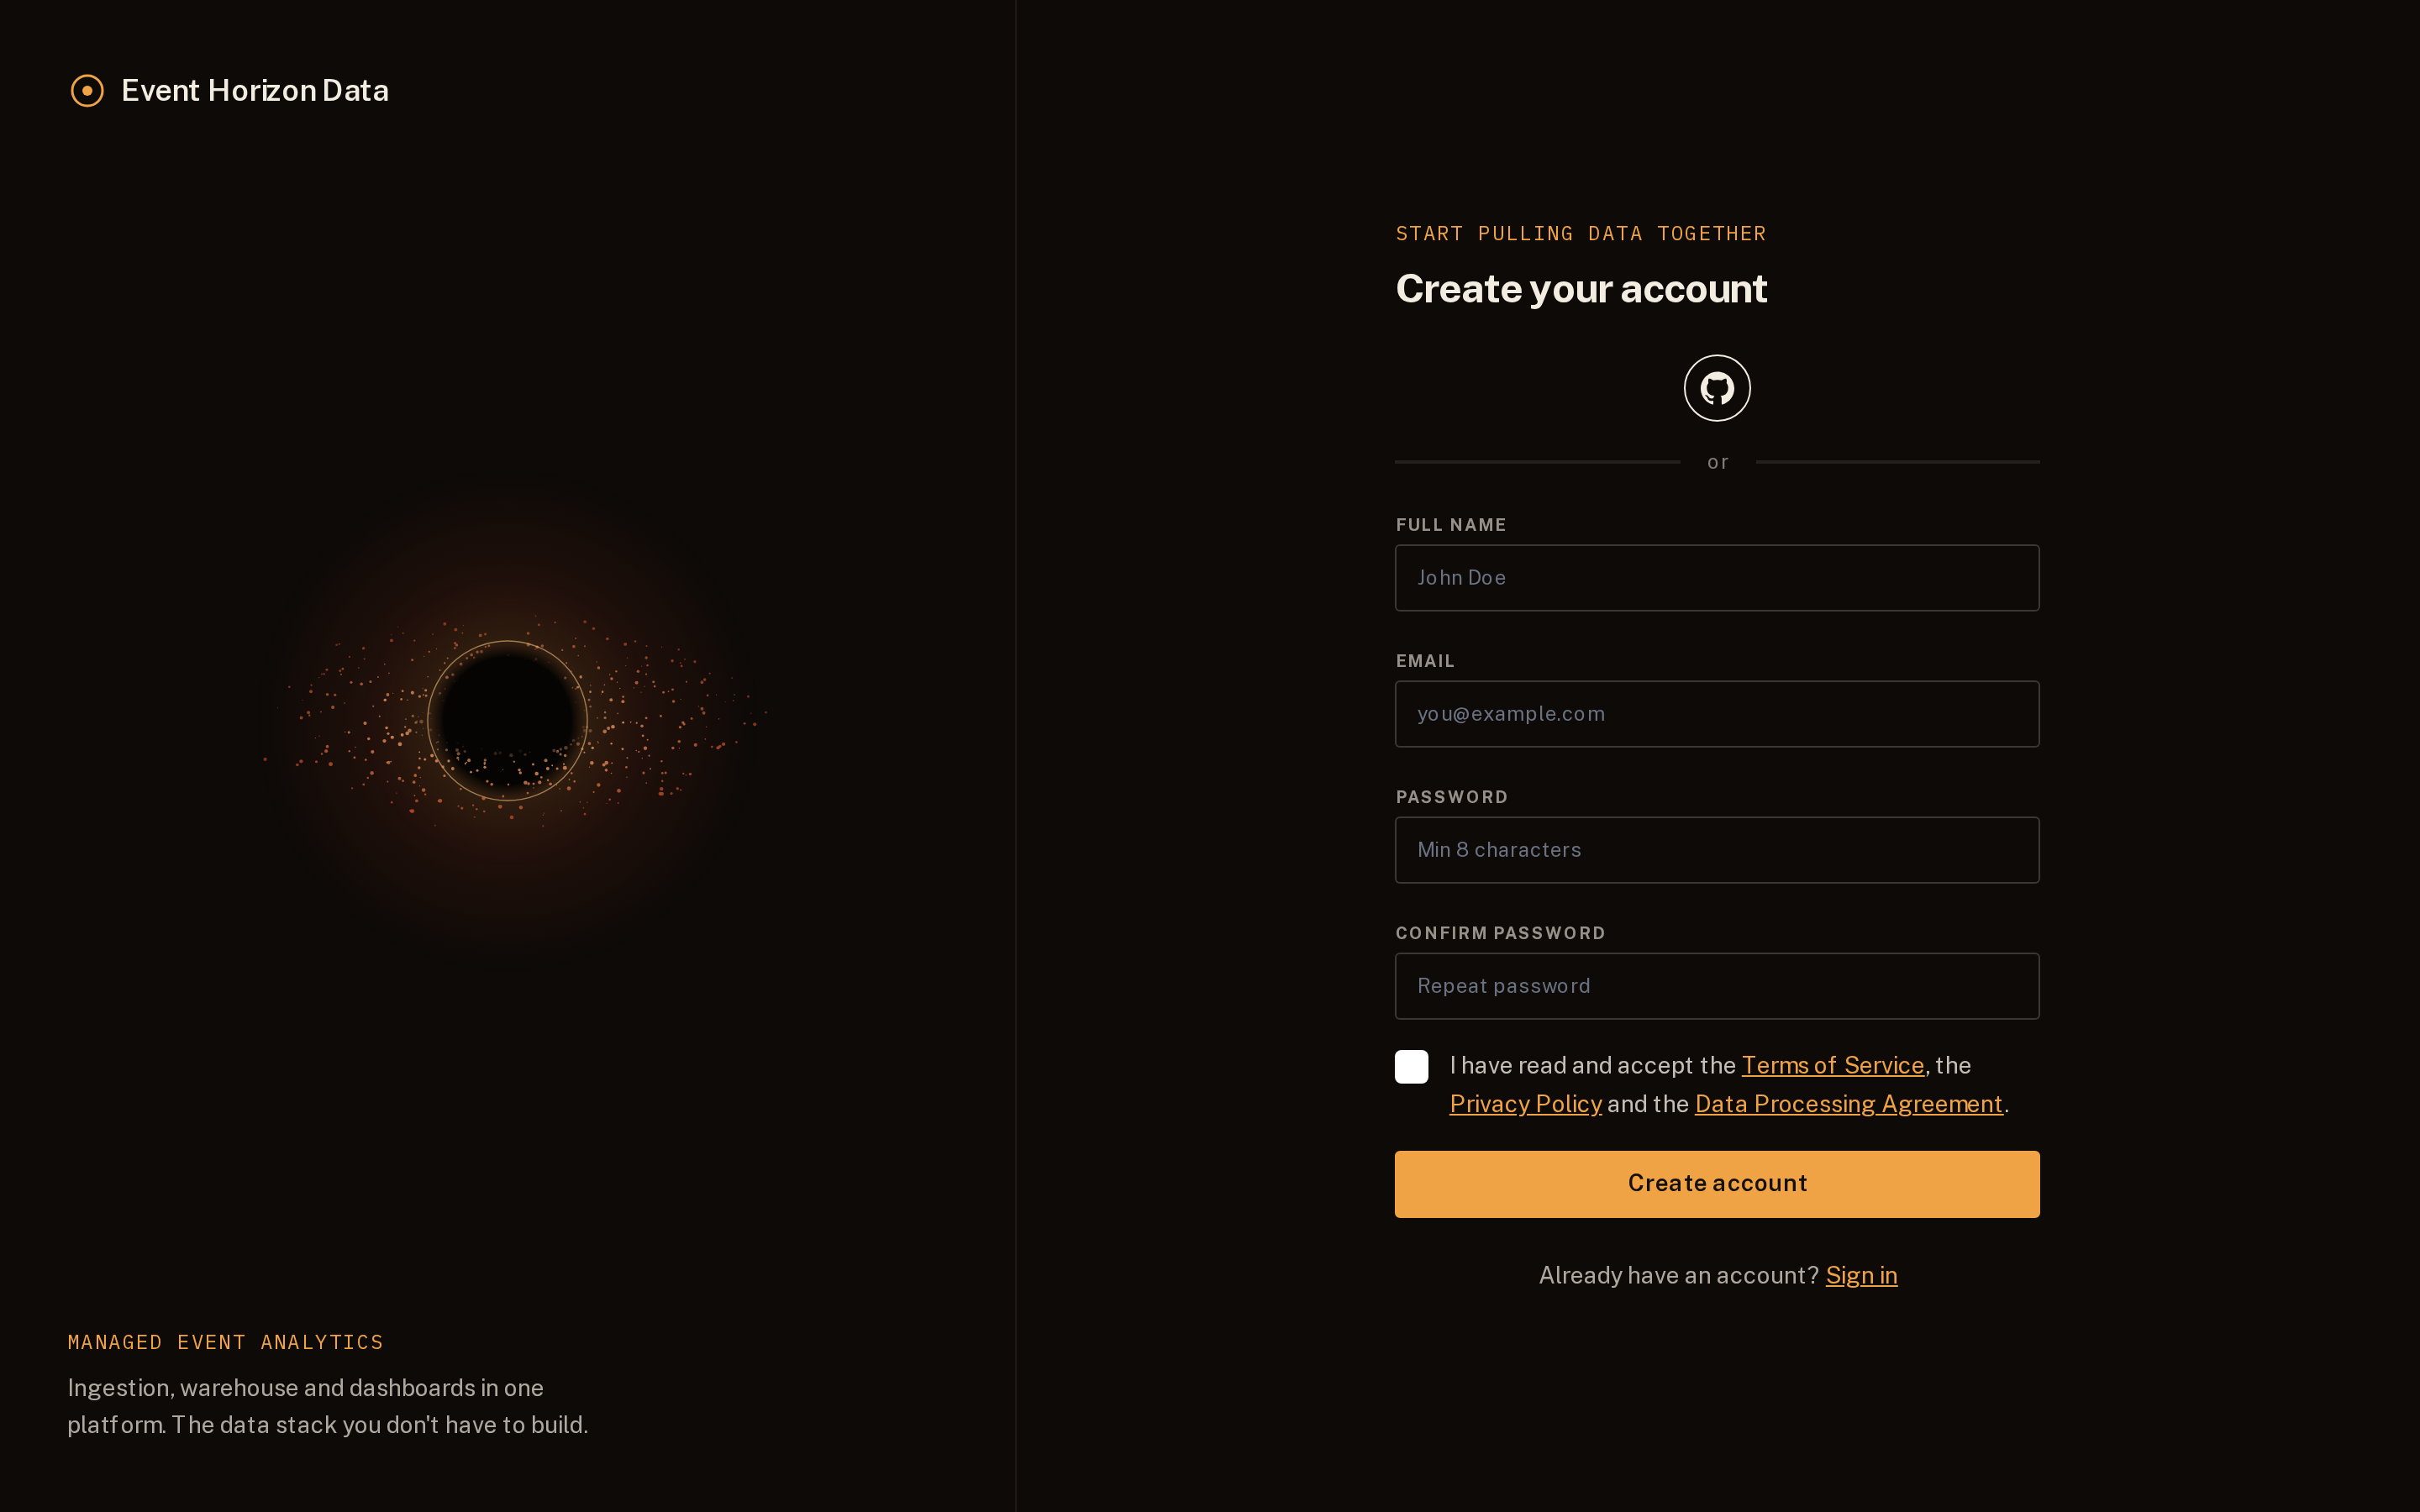
Create an account and your organisation.
The first organisation member becomes an administrator and can invite the rest of the team.
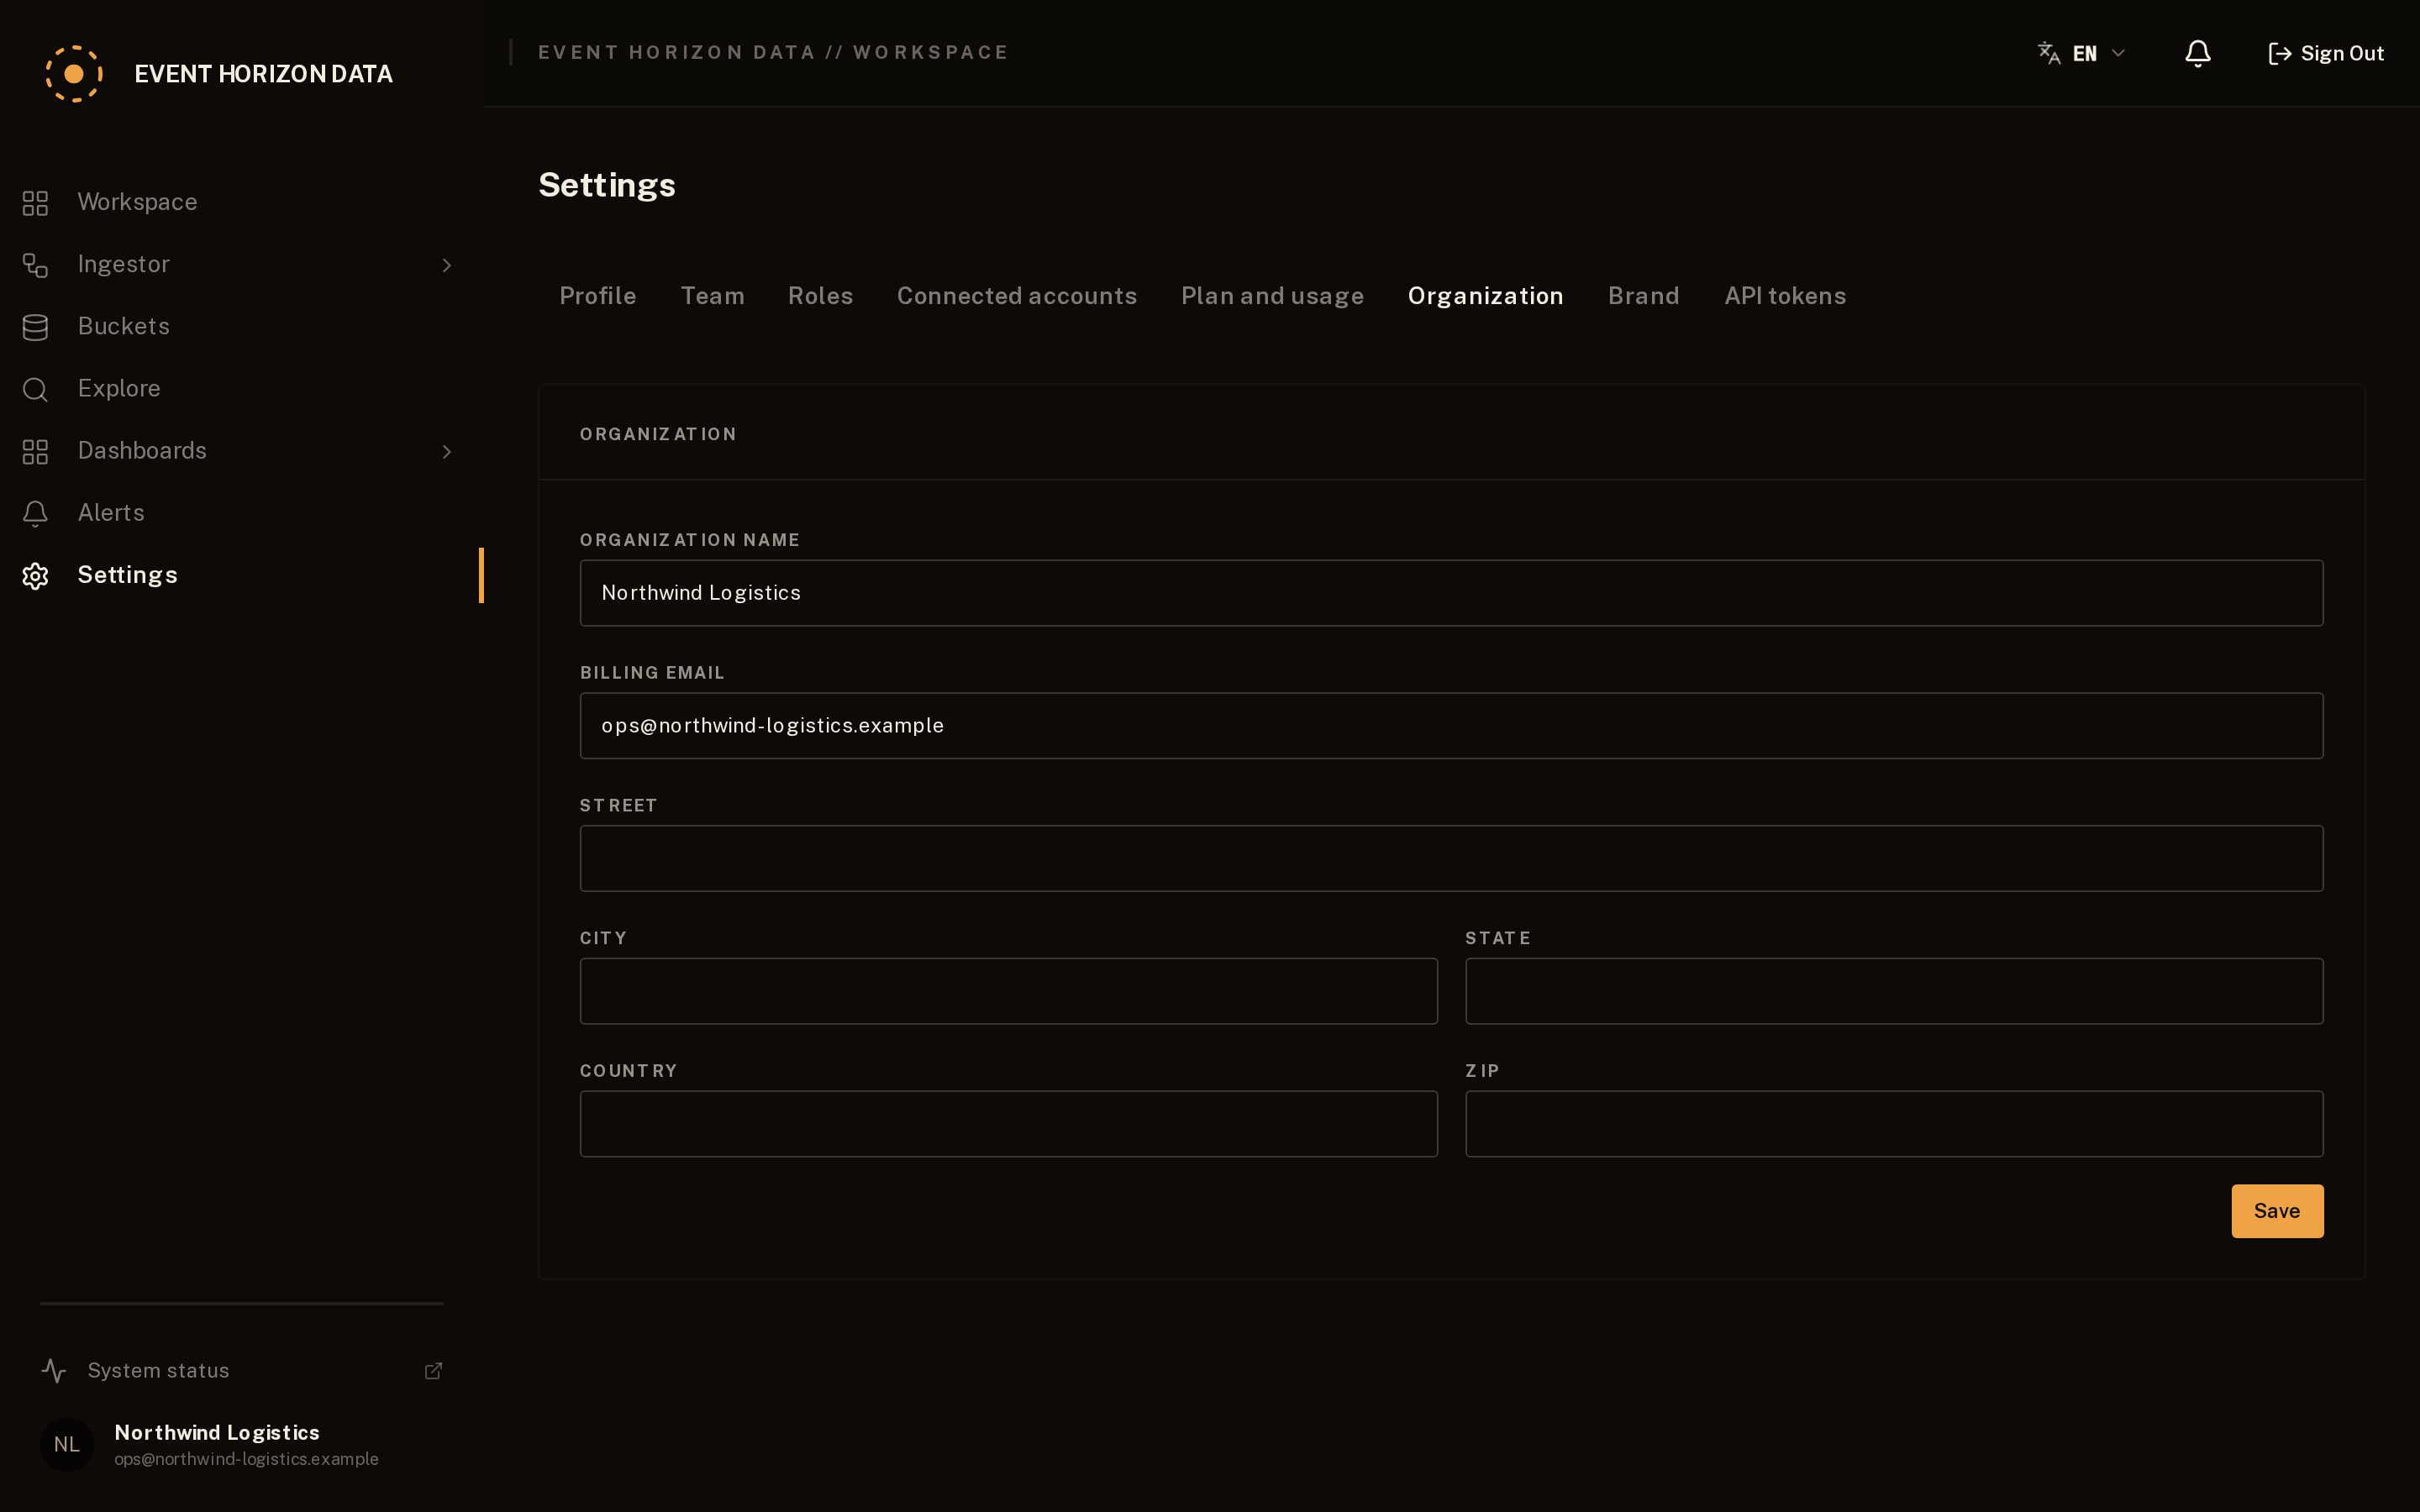
Settings → Organisation holds your company name, billing email and address. Settings → Brand is where you set the logo and colours your clients see on shared dashboards and embeds.
02
Define your data
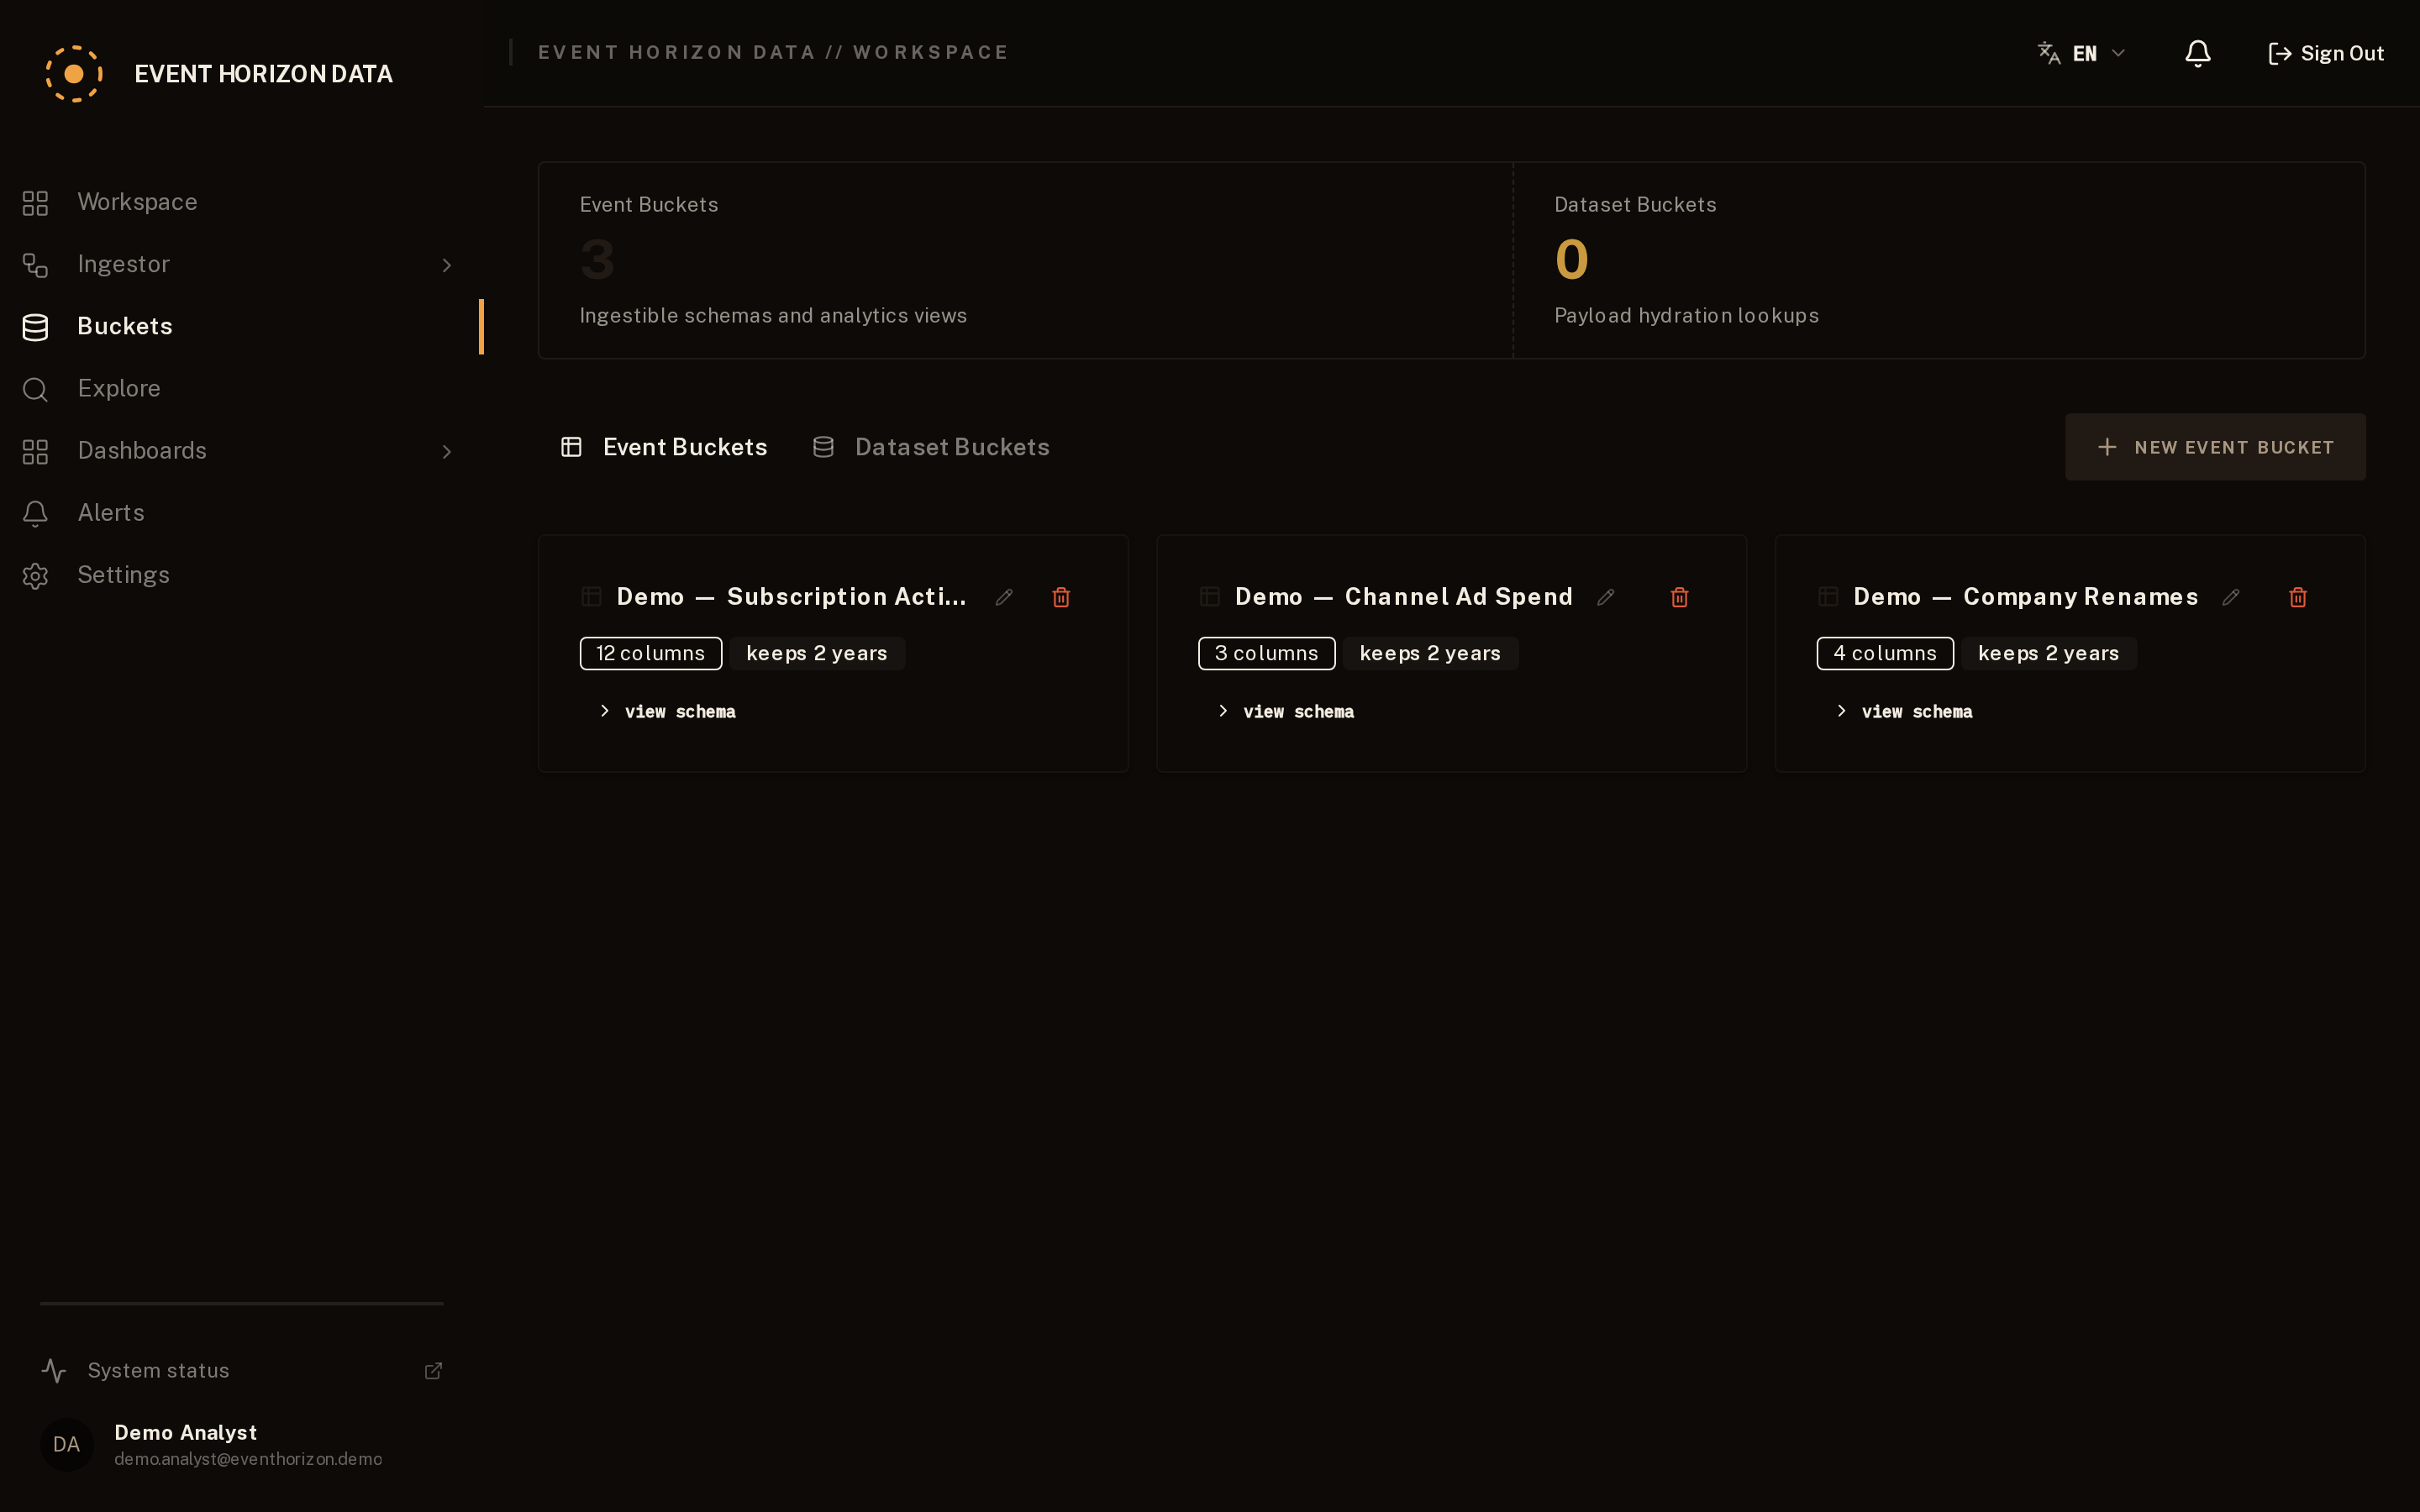
Create an event bucket from a sample event or define its fields yourself.
Specify timestamps, dimensions and metrics.
Event Horizon uses that structure to make the data queryable.
An event bucket defines both what you send and how you analyse it. Paste one sample event and the columns are proposed for you, typed and classified, with the reason for each; you confirm or correct them. Nothing is created until you do. You can also declare them by hand, choosing what each one is:
| timestamp_key | When the event happened. Required, and it is what every time filter reads. |
| dimension | What you group and filter by: country, campaign, subscription plan. It is stored as it was when the event happened, so what a company was called in 2020 still reads 2020. |
| metric | What you add up or average: revenue, duration, quantity. |
Declare the time zone your data comes from. Everything is stored in UTC, and an undeclared zone is assumed to be UTC. A misread hour cannot be corrected afterwards.
Timestamps can be an ISO-8601 string, or a plain epoch number in either seconds or milliseconds. We read the unit from the magnitude, so `1787232000` and `1787232000000` are the same instant. A number that arrives as a string is read the same way.
03
Connect a source
Send data through a webhook, database change stream, API workflow or another supported ingestion method.
Start the workflow. Event Horizon handles the ingestion path.
The shortest path is a webhook, and a new workflow already opens with one wired to a Loader. If your data comes from somewhere else, the bar above the canvas swaps it for another common shape: a database we follow as it changes, or an API we call on a schedule. Save it, and the address is generated for you and cannot be edited, because it is derived from your organisation and that node so it can never collide or be forged.
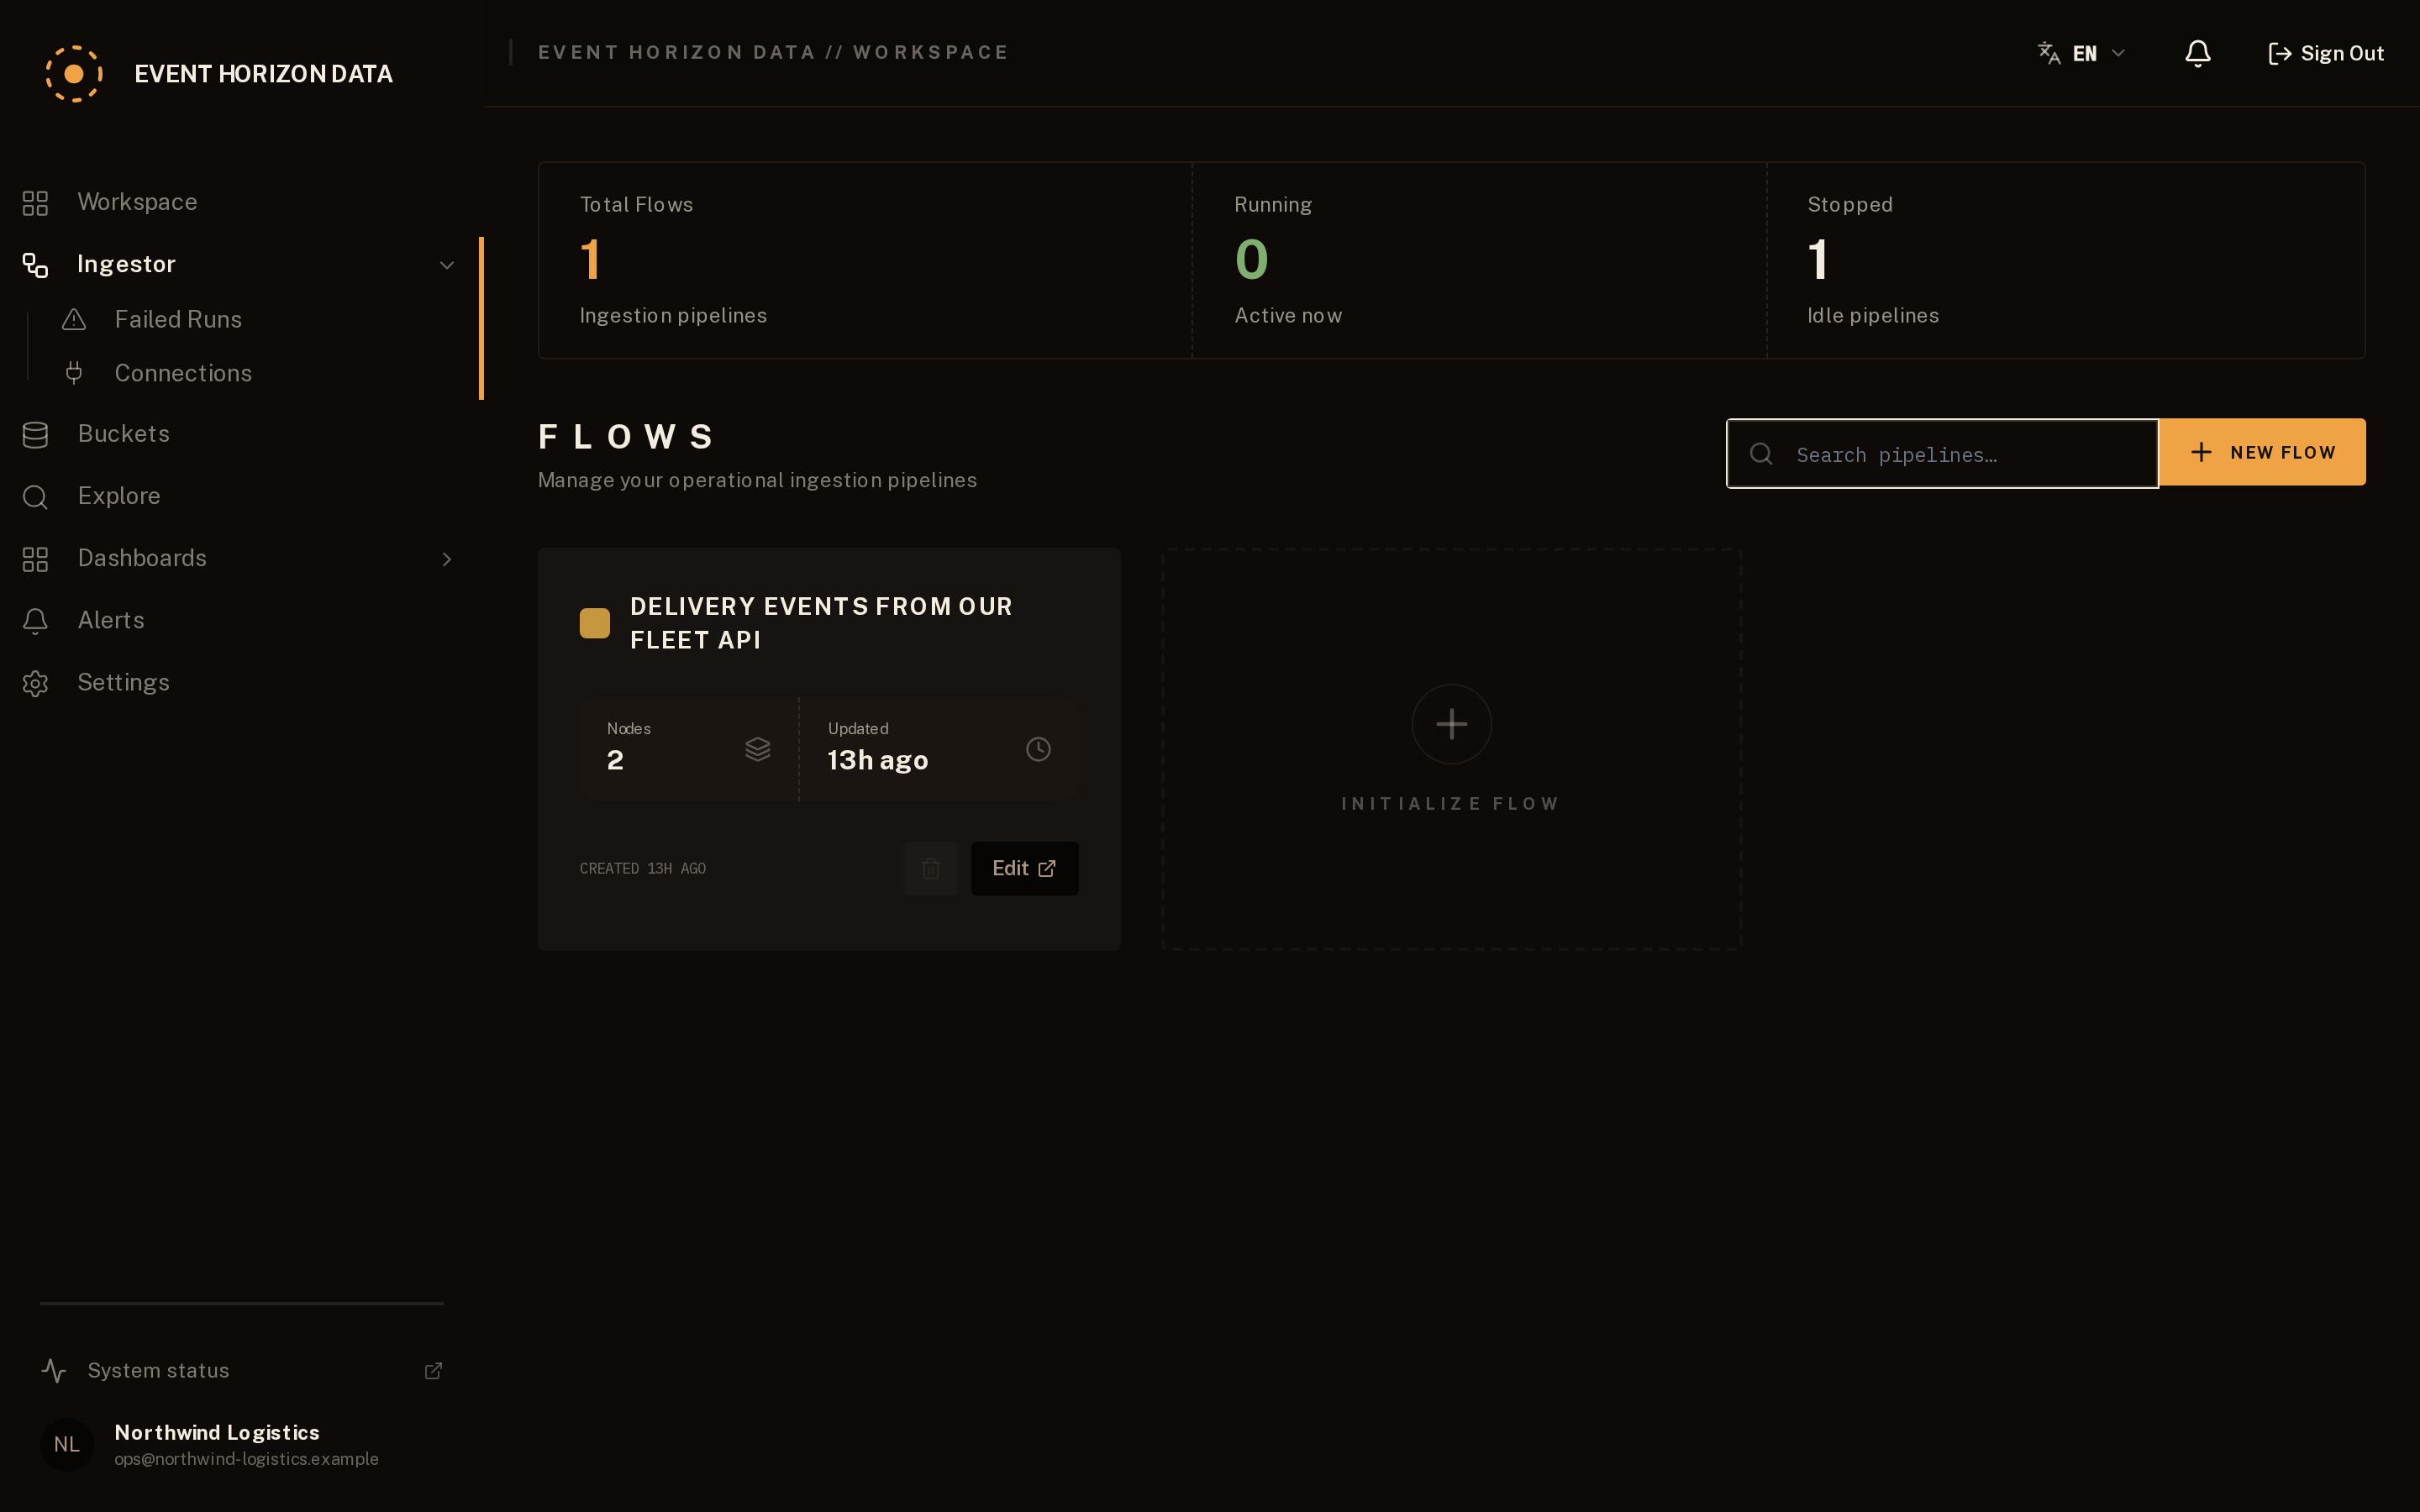
In the node inspector, choose Manage secret → Generate. The key is shown once and stored only as a hash, and not even we can recover it. Lose it and you generate another. Then post to the address shown in the node's URL field:
curl -X POST "https://ingest.eventhorizondata.com/webhooks/<org>/<node>" \
  -H "Authorization: Bearer <key>" \
  -H "Content-Type: application/json" \
  -d '{"event_id":"evt-1","value":42}'
Note the ingest. host. Ingestion has its own entrance, separate from the application, and a request sent to the app domain will be refused.
Start the workflow. A webhook node only accepts traffic while its workflow is running.
Send an `event_id` in the body, or an `Idempotency-Key` header, and a repeat of the same identifier inside five minutes is discarded rather than stored twice. Send neither and every request is accepted as new, because we would rather not guess at what makes two of your events the same one.
A 401 means one of two things: no Authorization header, or a key that does not match. A node whose key has never been generated refuses everything, by design.
04
Look at your data
Open Explore and choose:
- What happened?
- Metric.
- To whom or where?
- Dimension.
- When?
- Time range.
Then build the query visually. No SQL required.
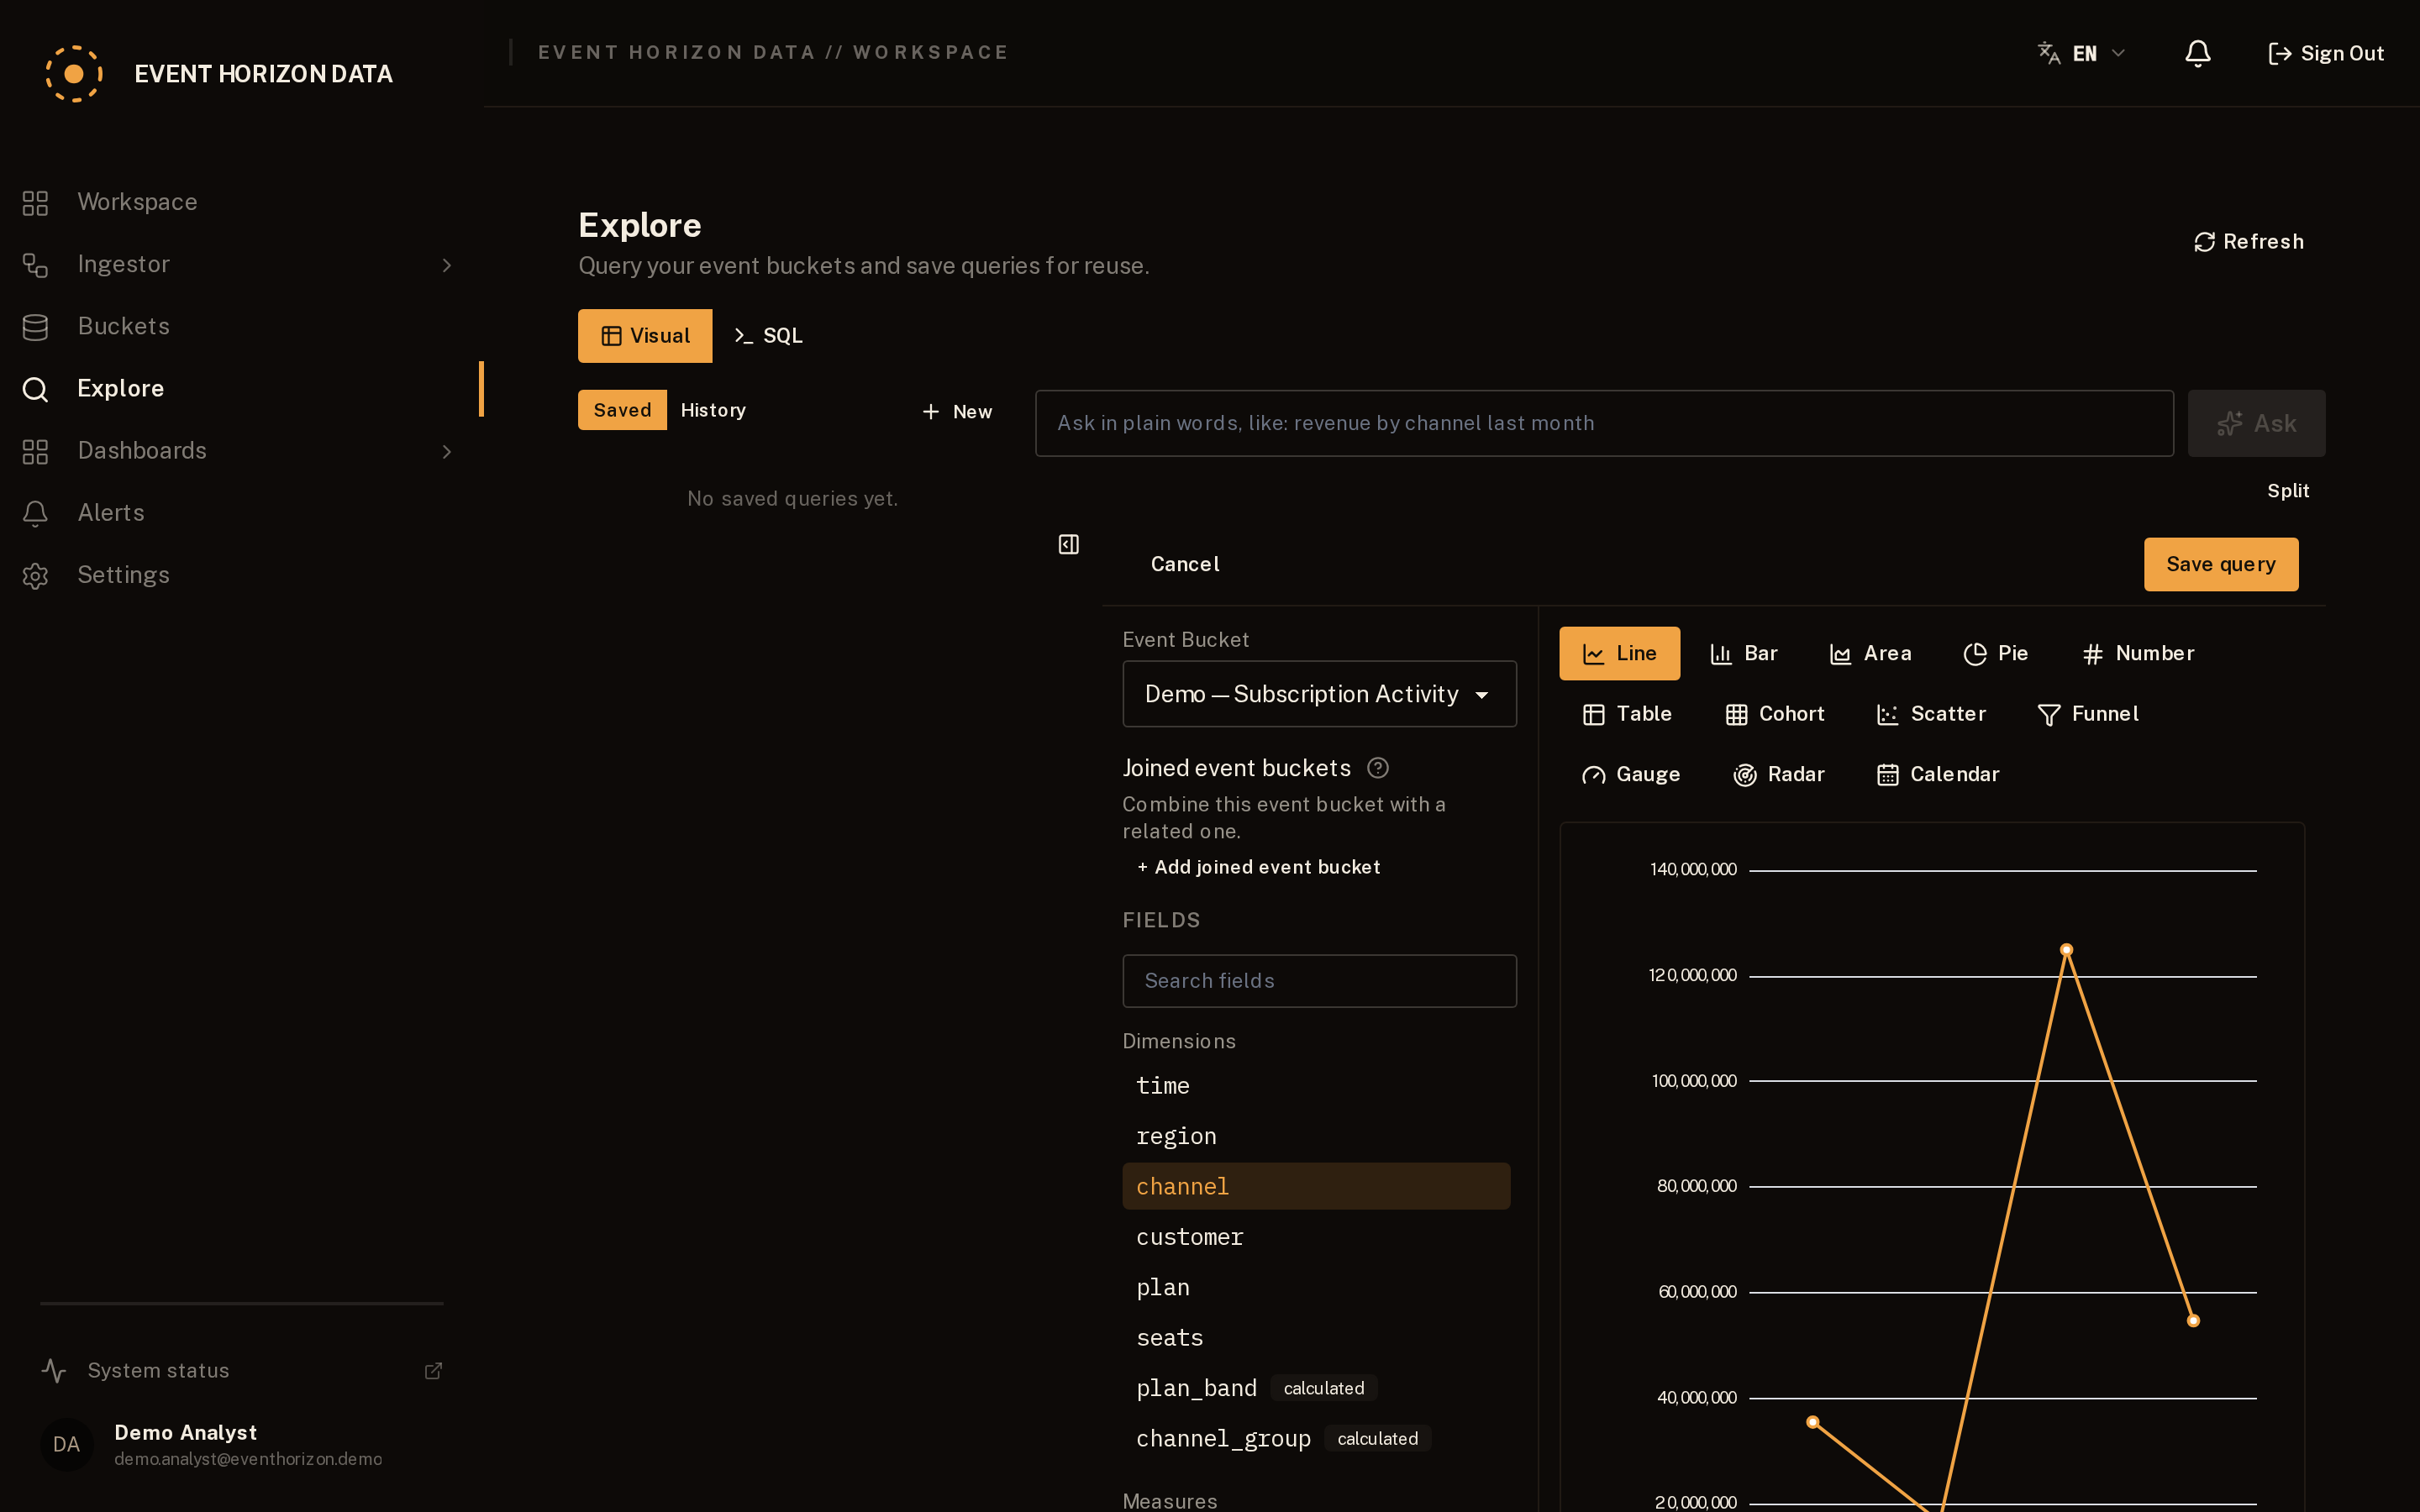
The query explorer needs no SQL: pick an event bucket, a metric, something to group by and a period. You can also type the question in plain words and press Ask, and the draft comes back filled in, with a note saying what it covered and what it left out. Nothing runs until you have looked at it. Dashboards are built the same way, and can be shared by link or embedded in your own product carrying your brand.
05
Build the dashboard
Turn the questions you care about into dashboard widgets. Filter and drill into the results.
Share the dashboard or embed it into your own product.
06
Control access
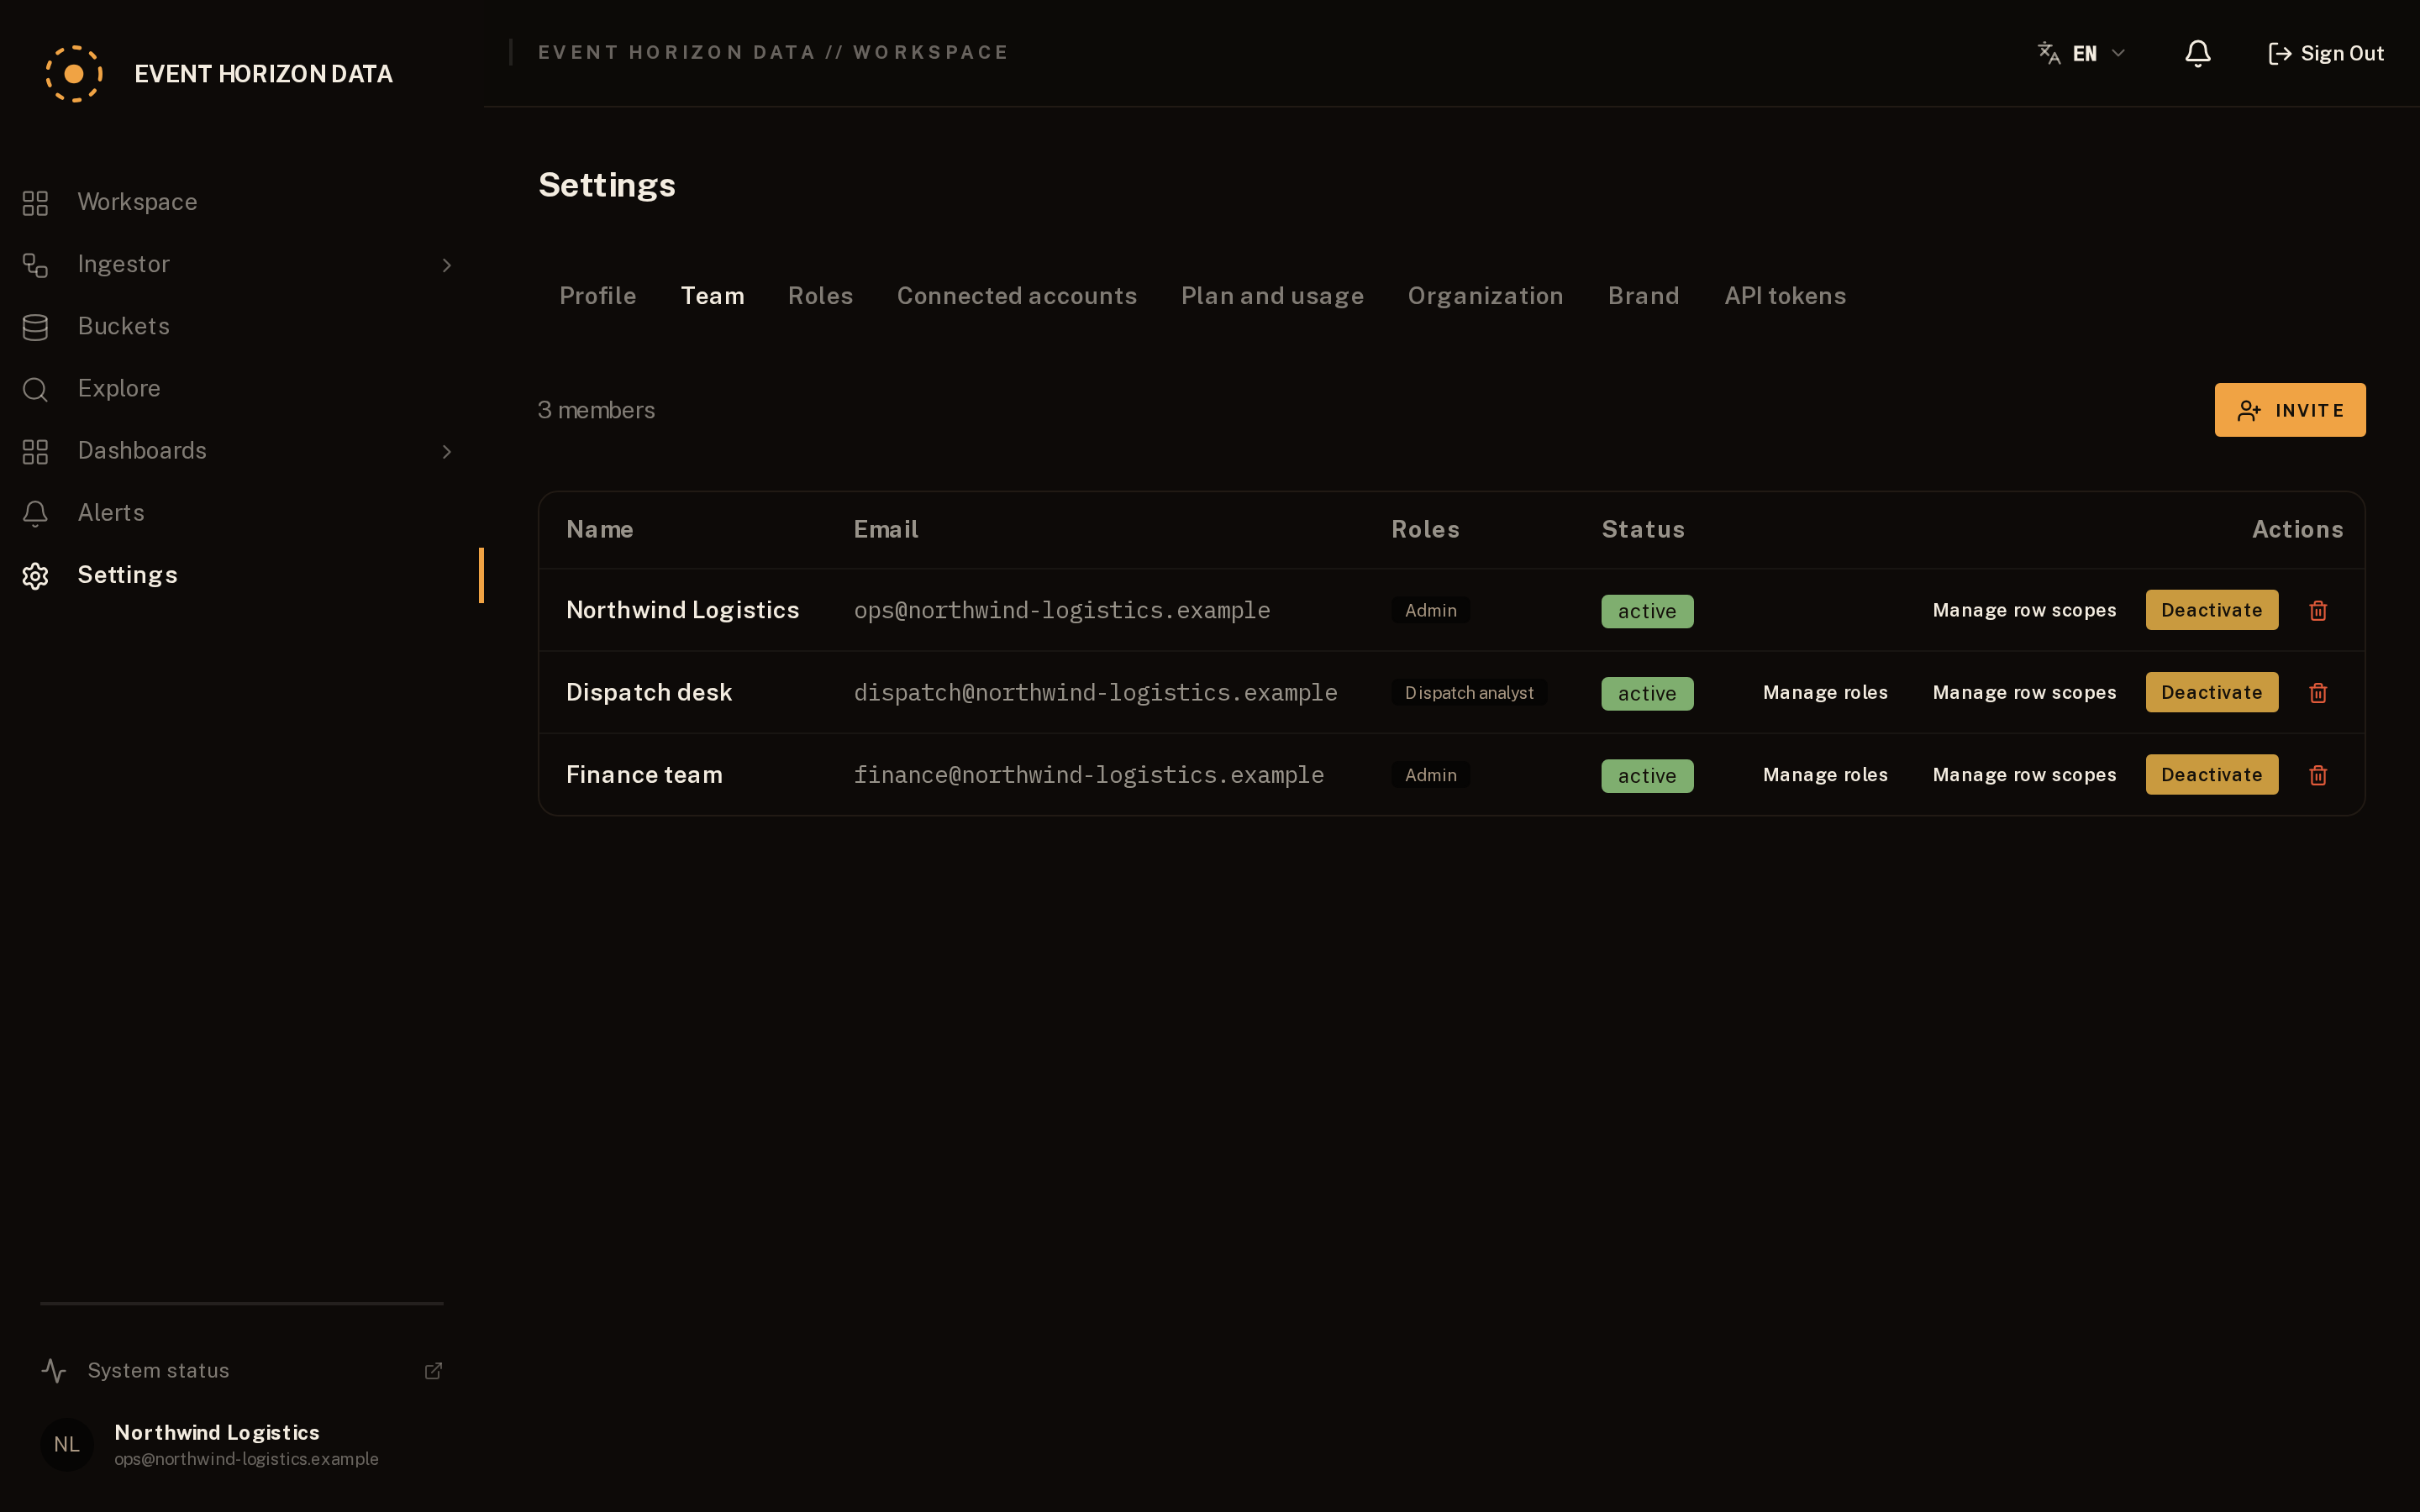
Invite your team. Assign roles. Use row scopes when someone should only see part of the data.
Settings → Team to invite people, Roles to design what they can do, and row scopes to limit someone to part of the data, such as a client of yours who should only ever see their own region.
07
Use SQL when you need it
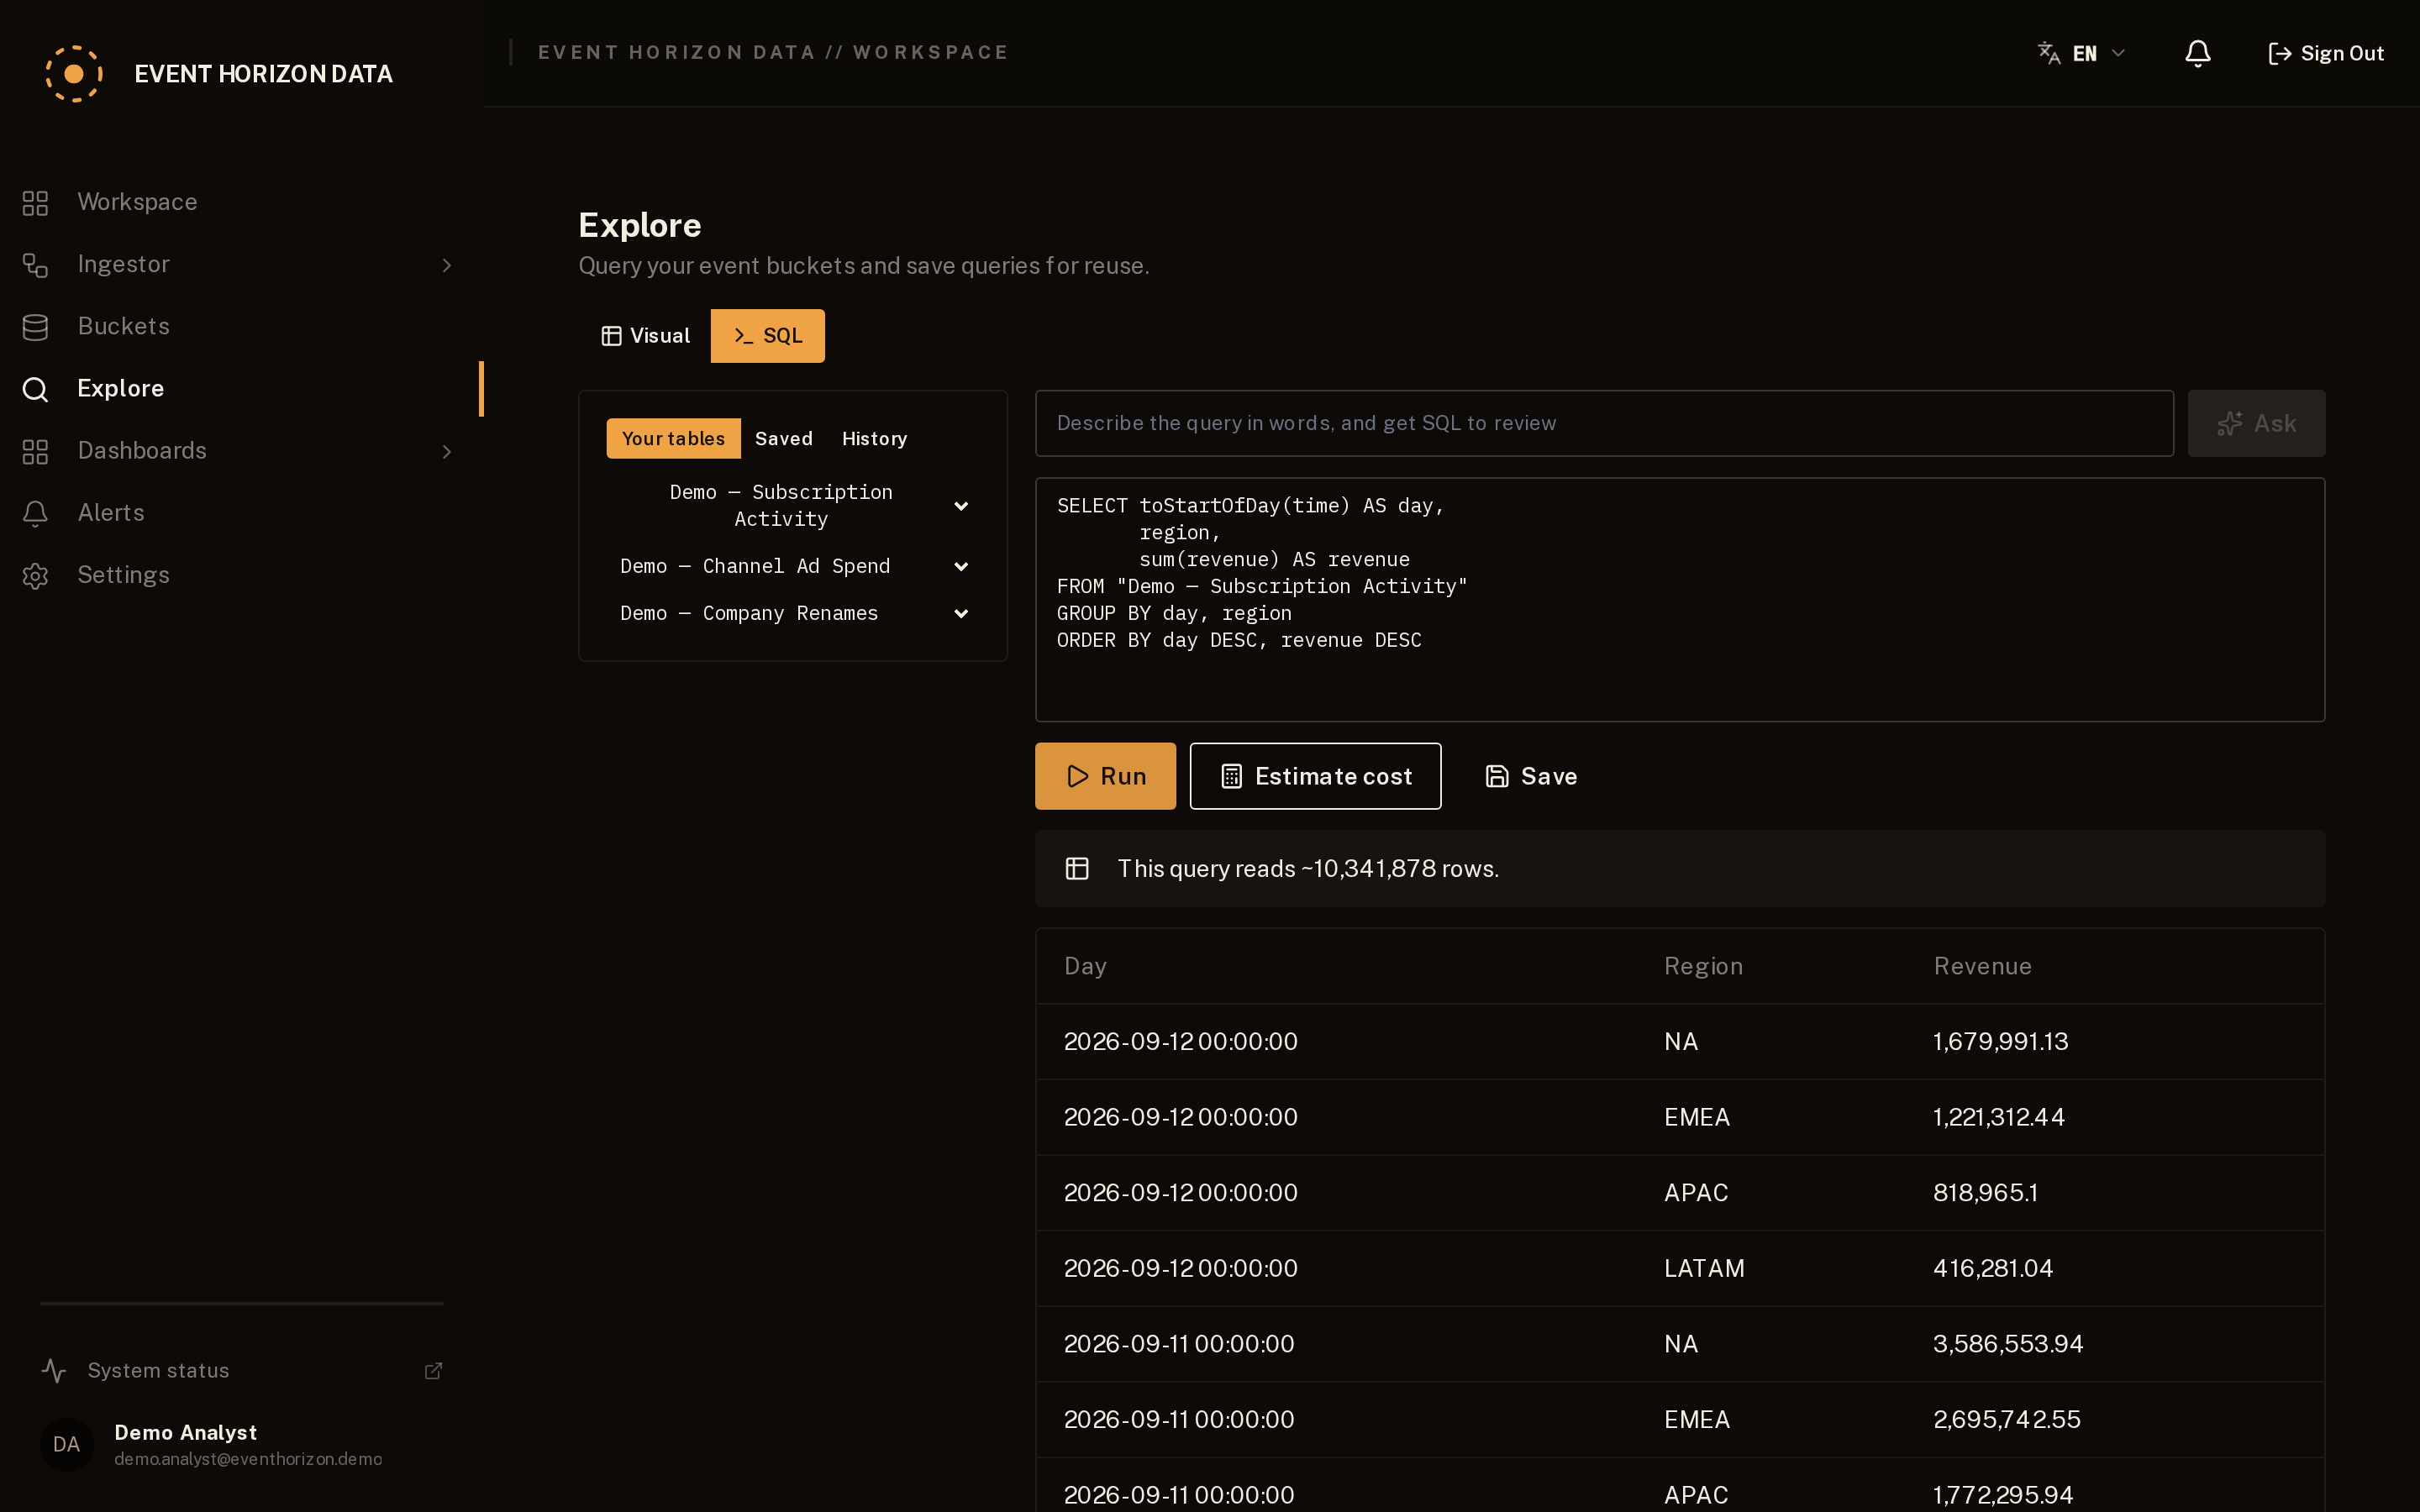
When the visual interface isn't enough, use the SQL interface. Queries are validated, tenant-scoped and cost-checked before execution.
Save useful queries as dashboard widgets. Connect Python, R or Jupyter when your workflow needs a notebook.
Most questions never need SQL, but when you want it, Explore has a SQL tab. You write ordinary SQL against your event buckets as if each were a table, without seeing how the warehouse stores them underneath. Your query is validated and rebuilt on our side, locked to your organisation, so it can only ever read your own data.
Every query is costed before it runs, the way BigQuery's dry-run works: one that would scan more than your plan allows is refused up front, with the estimate shown, so a heavy query fails fast instead of running up a bill. Save a query you like and drop it onto a dashboard as a widget.
To query from a notebook, generate a token under Settings → API tokens, then send SQL to the data endpoint from Python, R or Jupyter. The tenant comes from the token, so a token can only ever reach its own organisation's data:
curl -X POST "https://eventhorizondata.com/api/v1/data/sql" \
  -H "Authorization: Bearer <token>" \
  -H "Content-Type: application/json" \
  -d '{"sql":"SELECT toStartOfDay(time) AS day, sum(value) AS total FROM orders GROUP BY day ORDER BY day"}'
The token goes in the Authorization header and can be revoked at any time; a revoked token stops working immediately. The response is JSON by default, or CSV with `?format=csv` or an `Accept: text/csv` header. `GET /api/v1/data/schema` lists the buckets you can query.
Stream events continuously
The webhook above is the quickest start. For a feed that never stops, two more paths land at the same kind of ingest node, on the same ingest host, behind a key you generate once and that we store only as a hash.
From your own code, install the SDK. It works in Node and the browser, batches records, and retries for you:
npm install @event-horizon-data/probe

import { Probe } from '@event-horizon-data/probe';

const probe = new Probe({
  endpoint: 'https://ingest.eventhorizondata.com/ingest/probe/<org>/<node>',
  key: 'ehp_<key>',
});

probe.send({ user_id: '123', action: 'click', value: 42 });
await probe.flush();
From log files or syslog, point the collection agent at a path and it ships each line, typed. Run it with npx, or download one self-contained binary that needs no Node installed:
npx @event-horizon-data/agent \
  --endpoint https://ingest.eventhorizondata.com/ingest/probe/<org>/<node> \
  --key ehp_<key> \
  --tail /var/log/app.log
Both send an event the same way the webhook does, so the idempotency rules above still apply: a repeated identifier inside five minutes is discarded. The agent also survives a restart without losing a line or sending one twice. Both are open source, MIT, on npm.
Plans and billing
You are billed by events. One event is one record loaded into a bucket: an order, a payment, a sensor reading, a webhook delivery. It is counted once, when it arrives, and a batch that gets retried is not counted again. Size is not part of the count, and neither is reading the data back: storage and the scan budget of each query are separate limits on your plan.
Every plan (Starter, Studio, Agency, Scale) sets those ceilings, and the pricing page shows the same numbers the product enforces. You begin on a 14-day trial and choose a plan under Settings, in Plan and usage.
That screen also shows what you have used. At 80% of a limit you are warned; at 100% new ingestion is queued rather than dropped, until you upgrade or the month resets, so nothing is lost. Reading your data stays open throughout, so the numbers and the upgrade button are always in reach.