Managed event analytics
The data stack you don't have to build
Ingestion, warehouse and dashboards in one platform. Connect your sources, model them once, and give every client a dashboard with your brand on it. There is no pipeline to wire together and no warehouse to run.
Three stages of gravity
From scattered signal to a single point of clarity.
01 · INGESTION
The Pull
Gather what's scattered. Pipelines drag every source toward you (APIs, databases, event streams) continuously, without you lifting a finger after setup.
02 · WAREHOUSE
The Core
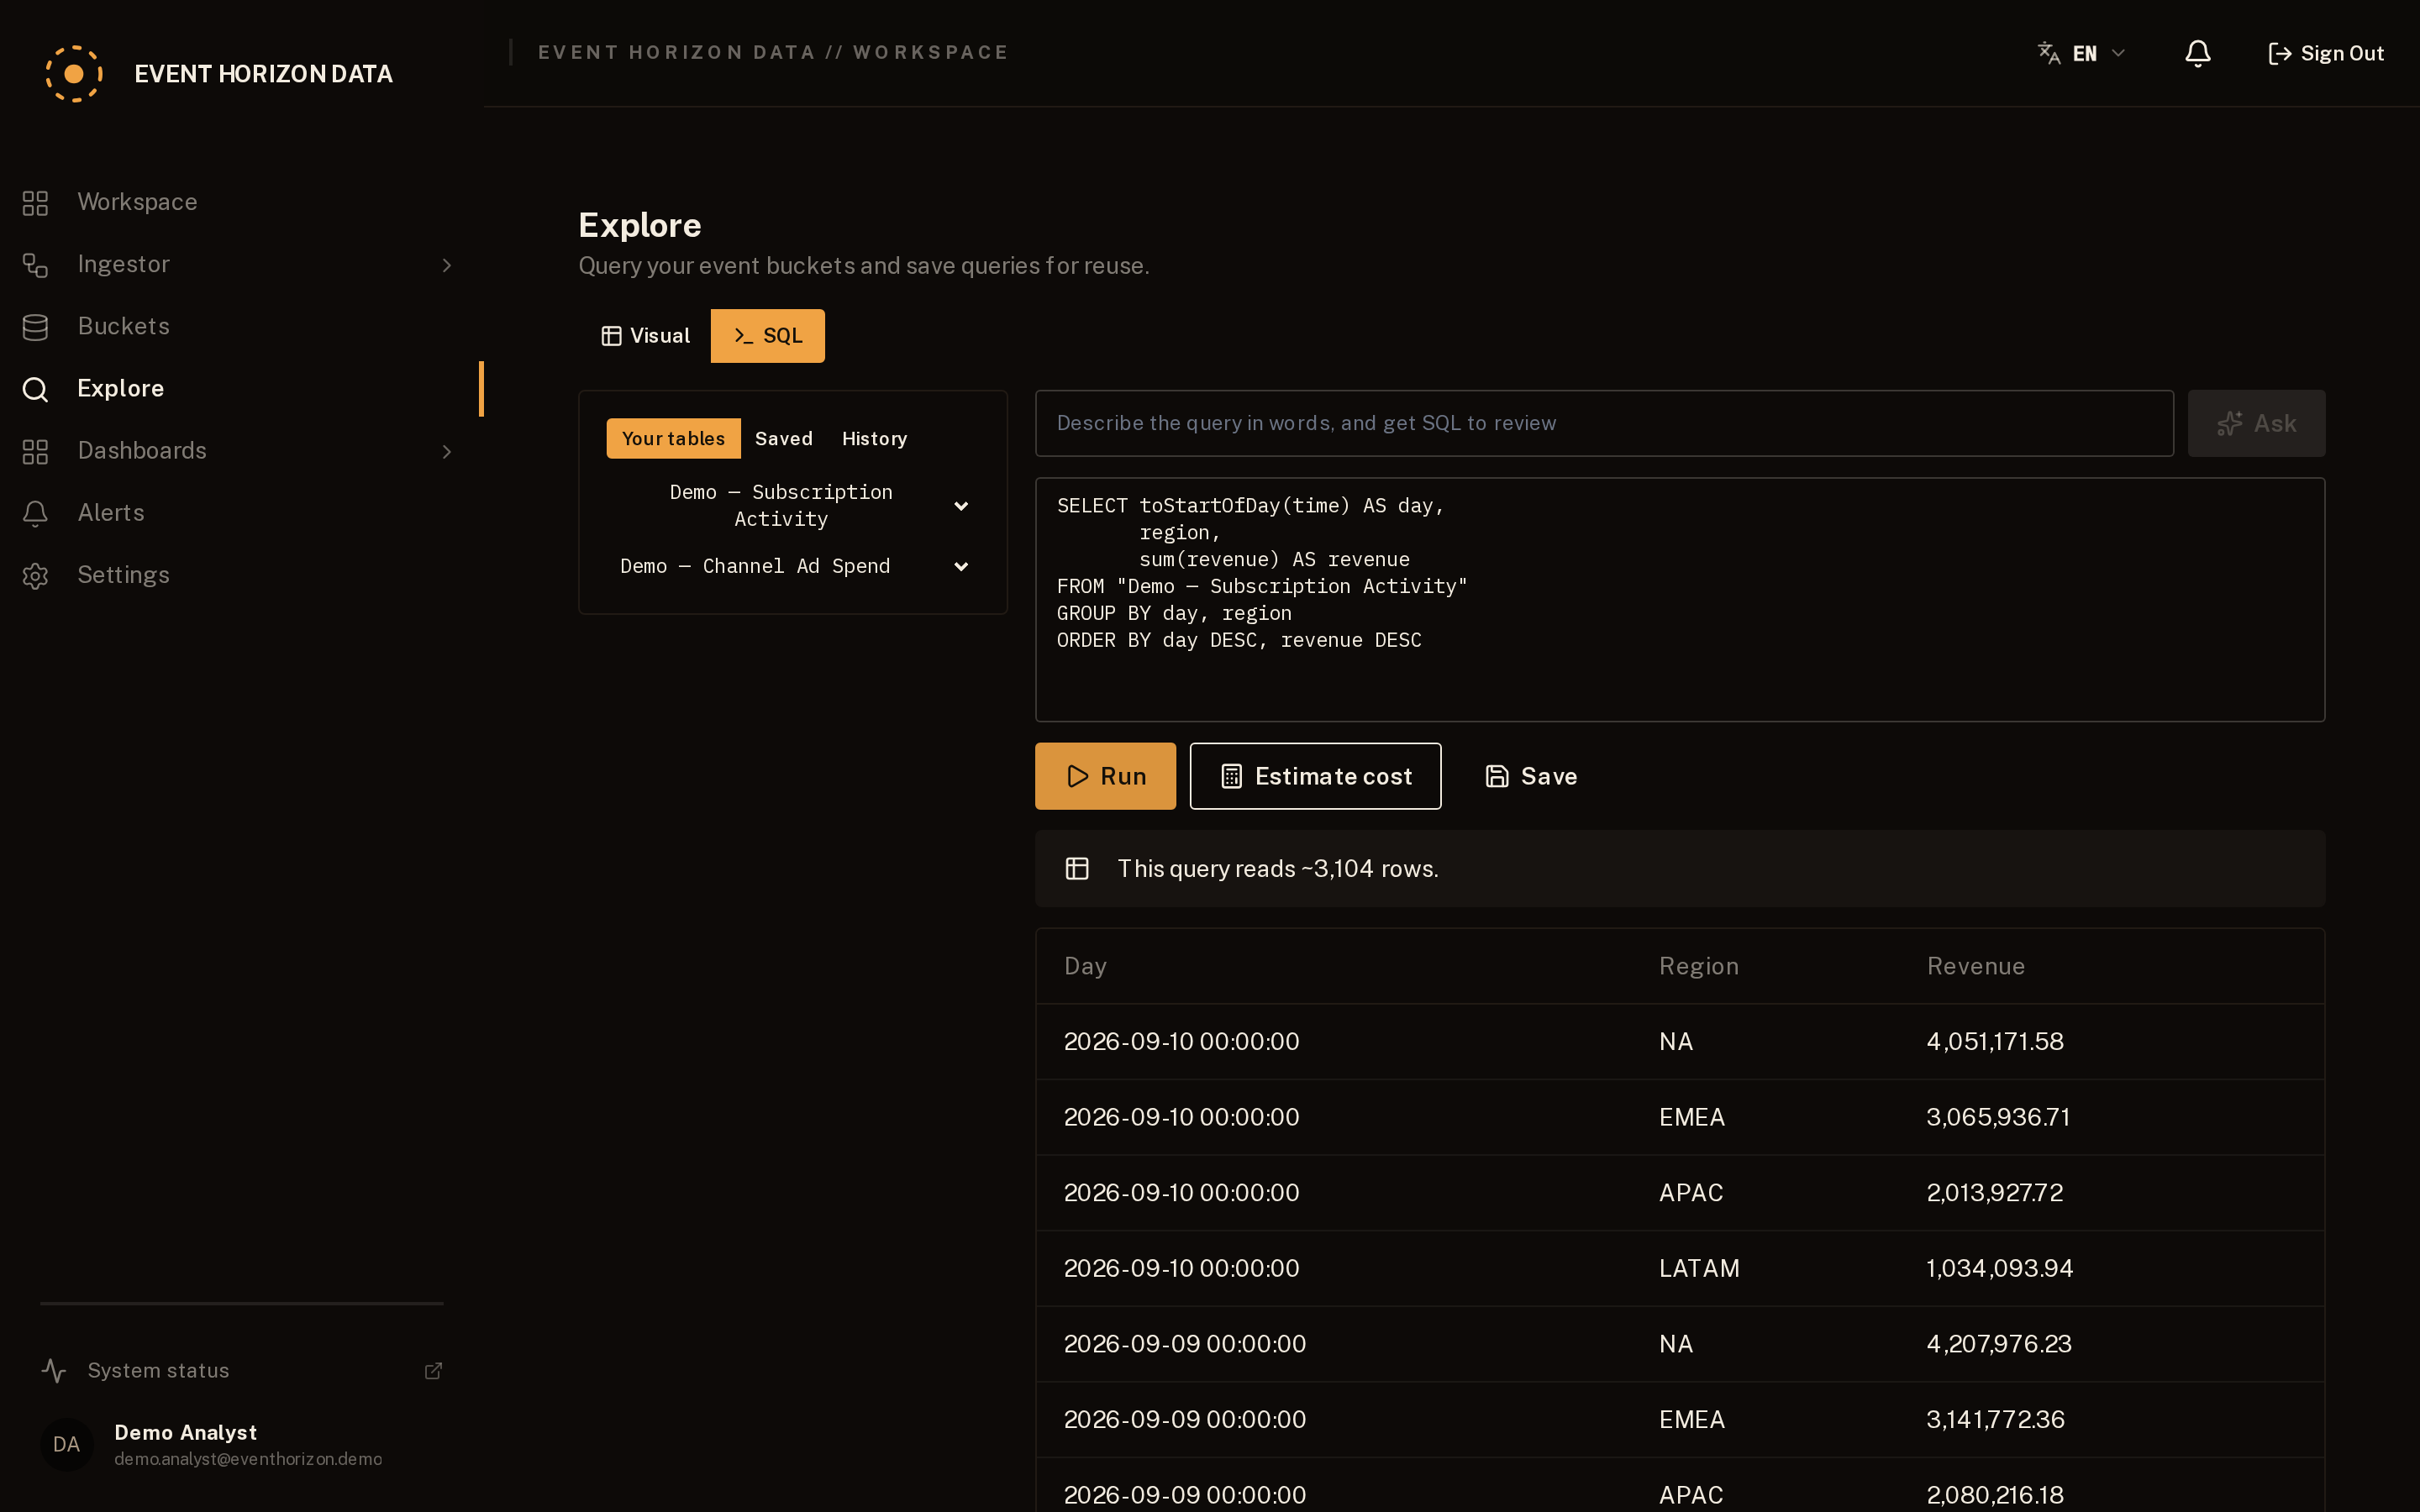
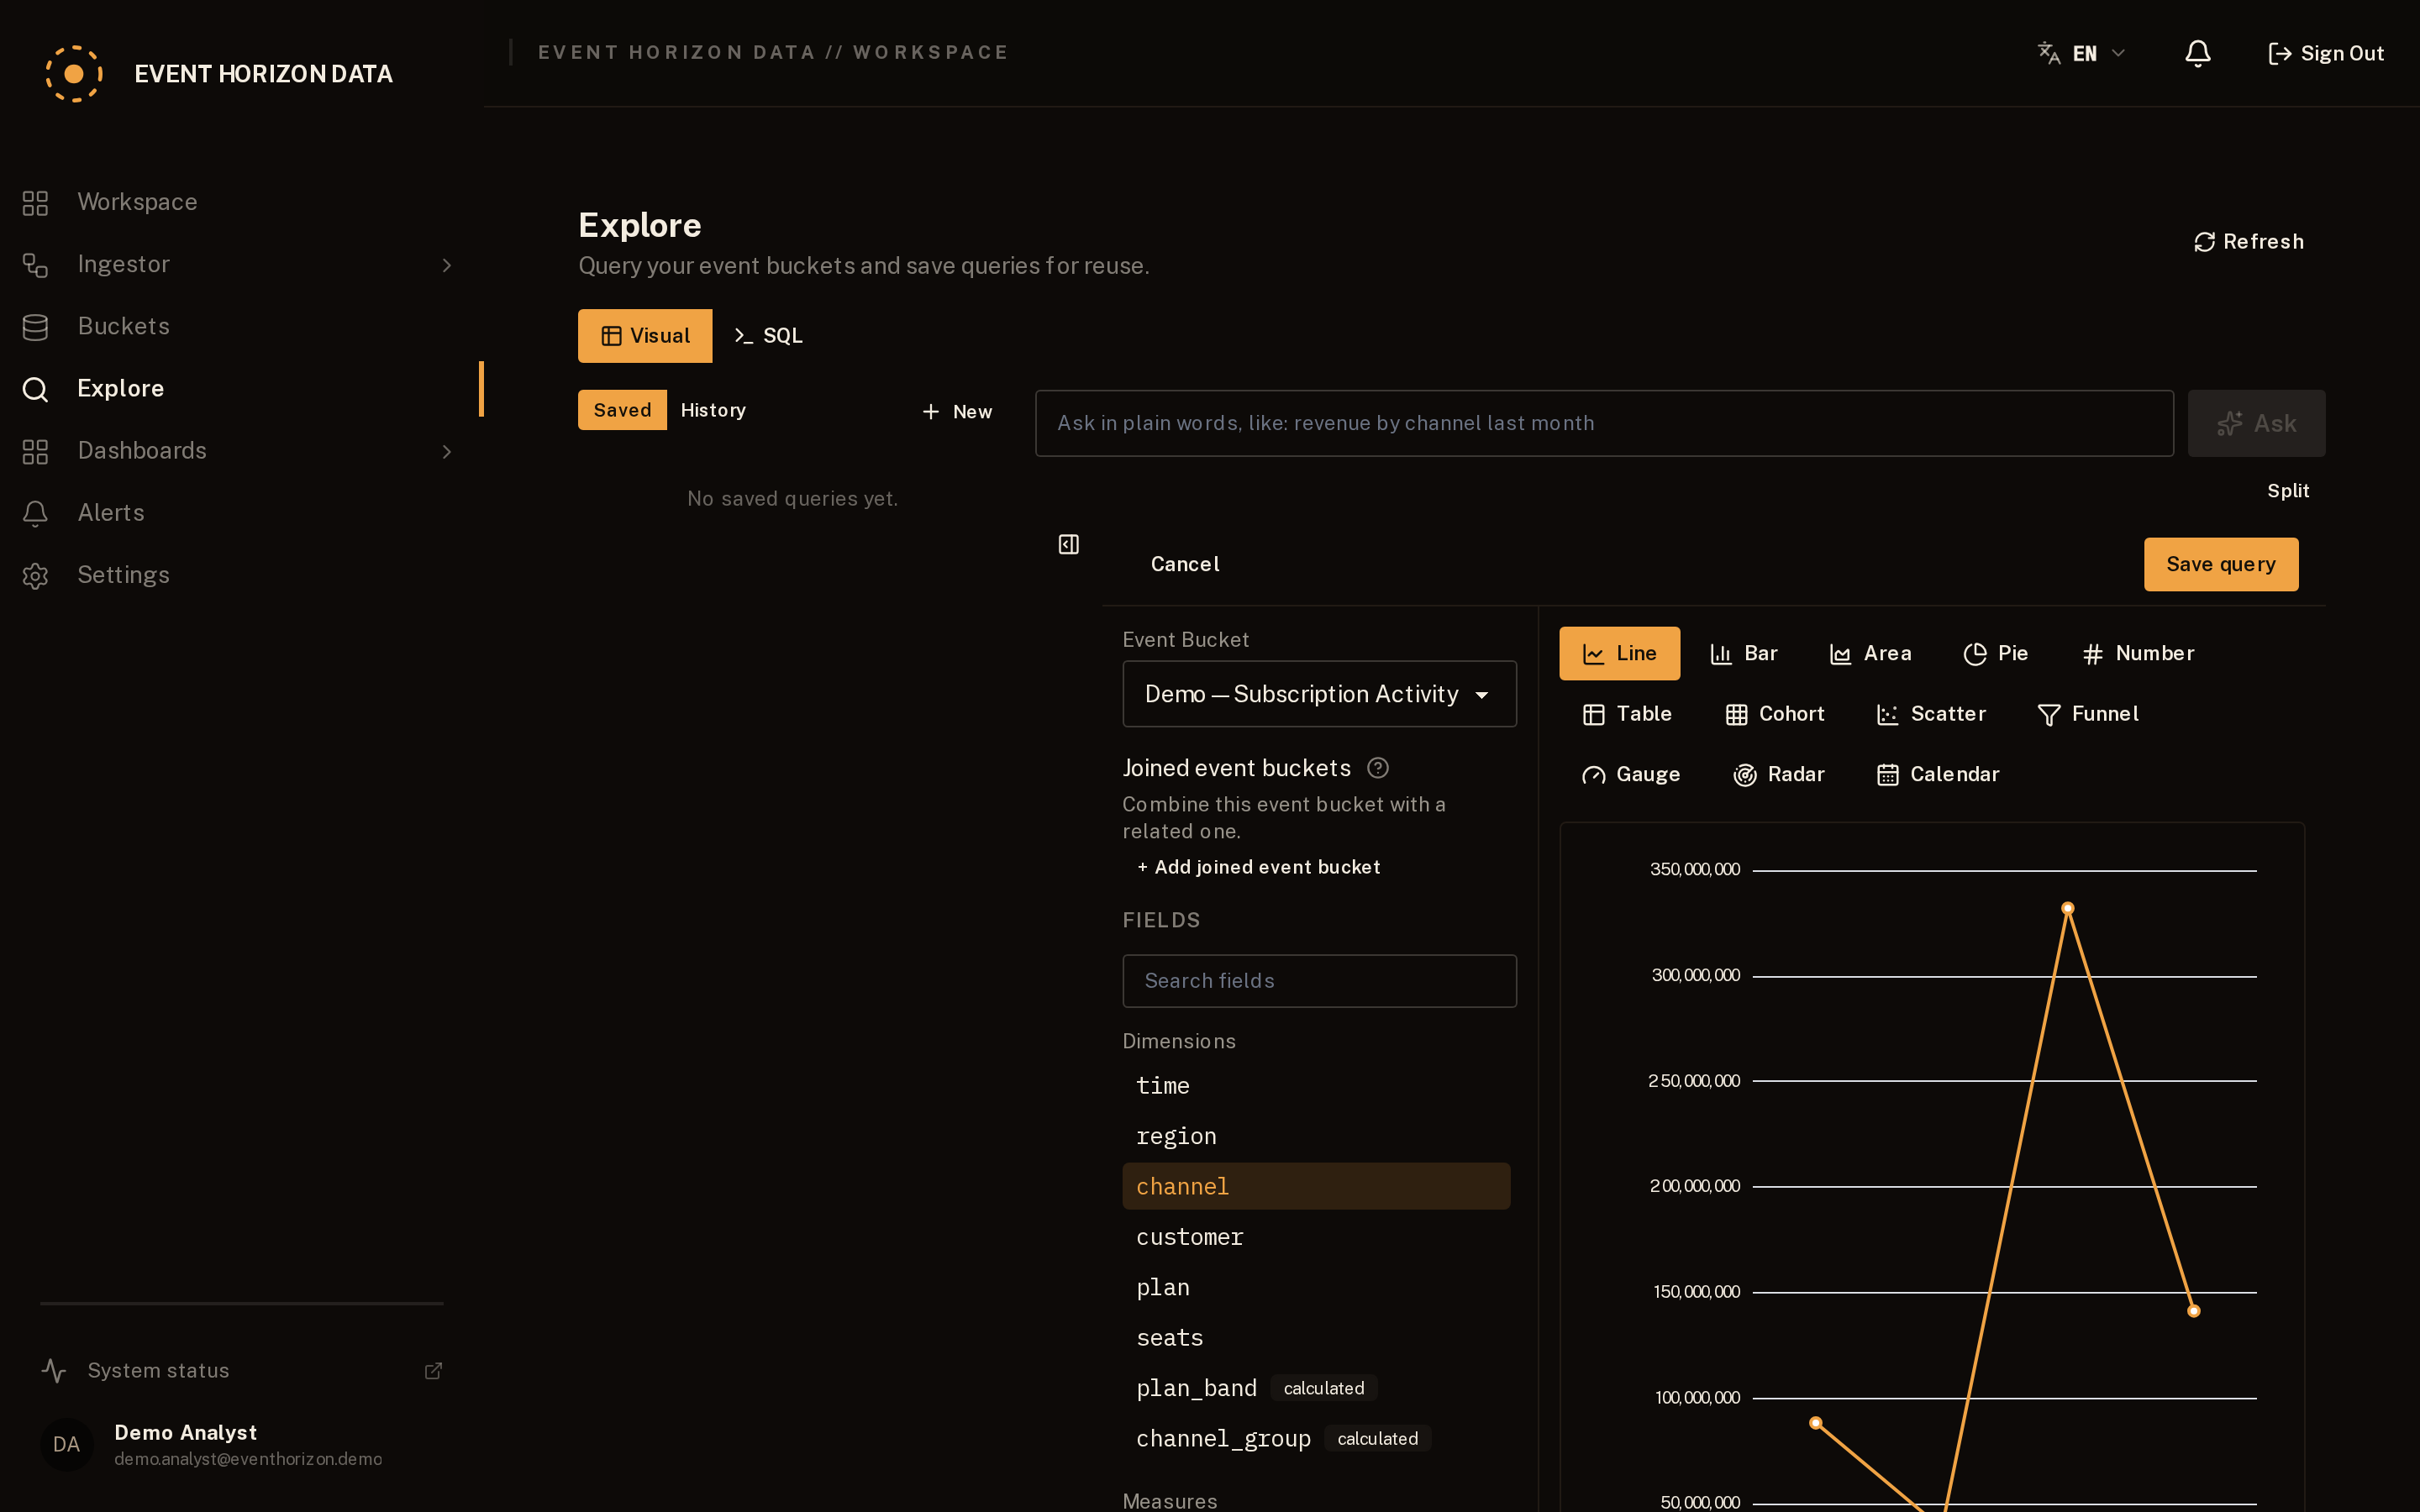
Give it mass. Raw events compress into modeled, typed event buckets: deduplicated, versioned, and queryable in seconds, not sprints. Ask in plain words, ask in clicks, or write SQL and point a notebook at it.
03 · DASHBOARDS
The Horizon
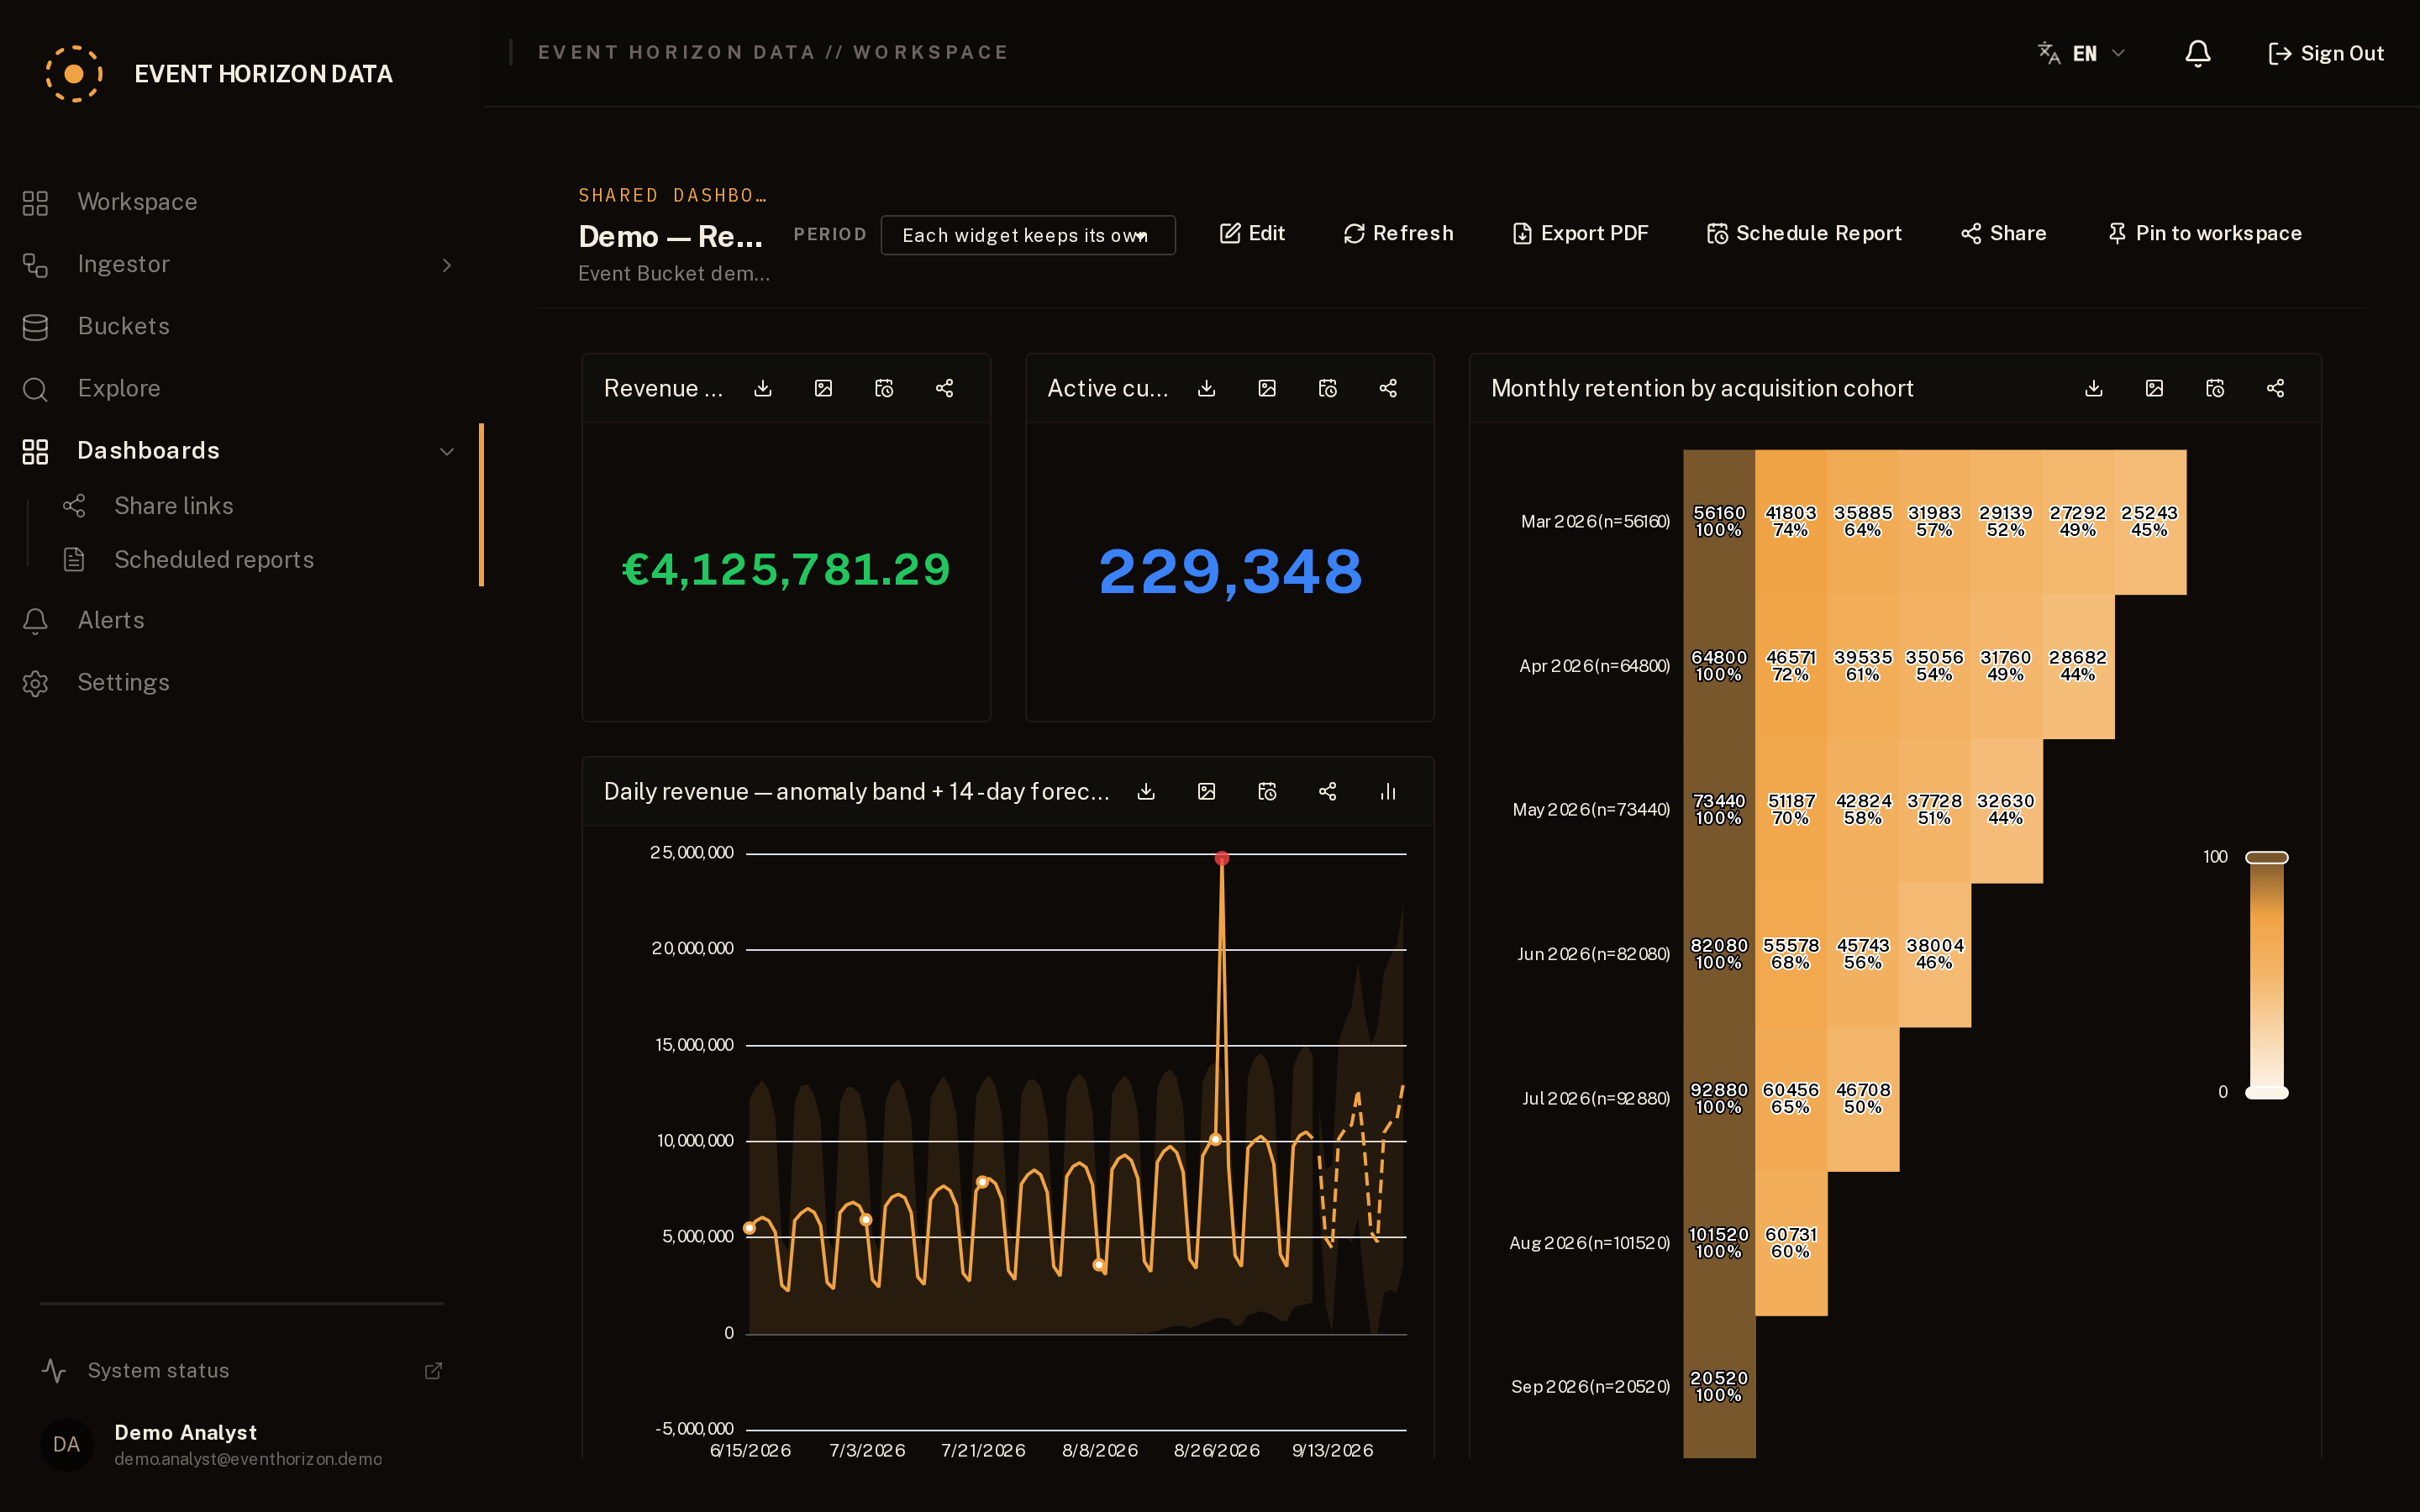
See what's inside. Dashboards are the boundary you stand at: the vantage point where raw data finally becomes a decision.
How it works
Three stages, one telescope.
STAGE 01
Gravity
Connect a source. Event Horizon Data starts pulling data toward you automatically, on a schedule you set once.
STAGE 02
Collapse
Data compresses into modeled event buckets: deduplicated, typed, and joined, ready for anyone on the team to query.
STAGE 03
Clarity
Cross the horizon. Build a dashboard and watch weeks of scattered noise resolve into one picture.
Field observations
Not a mockup. This is what teams actually see.
Ready to cross the horizon?
Set up your first pipeline in minutes. No credit card, no sprint planning.