We pointed Event Horizon at Event Horizon
One week our server disk reached 98.4 percent, 381 of 387 GB, and we found out by hand. The nightly backup had been failing for three weeks, leaving a multi gigabyte file behind every night, and nothing had told us. We had uptime checks for every service, and none of them looked at the disk, or at how long a dashboard request took, or at whether a backup had actually finished.
We could have bolted a monitoring stack on the side. We did the opposite and pointed our own product at our own servers, using nothing a customer cannot use.
What flows in
A small collector writes one JSON line per sample for the host, every container, ClickHouse and Mongo, and the Collection Agent tails that file like any other log. The API reports its own request traces over OTLP to an OpenTelemetry node in a pipeline, and every response carries a Server-Timing header that splits the time between the ClickHouse read, the model fit and the cache. A pipeline sorts the records by kind into event buckets in a private workspace of ours, and from there it is a normal tenant: the same builder, the same SQL Explorer, the same dashboards.
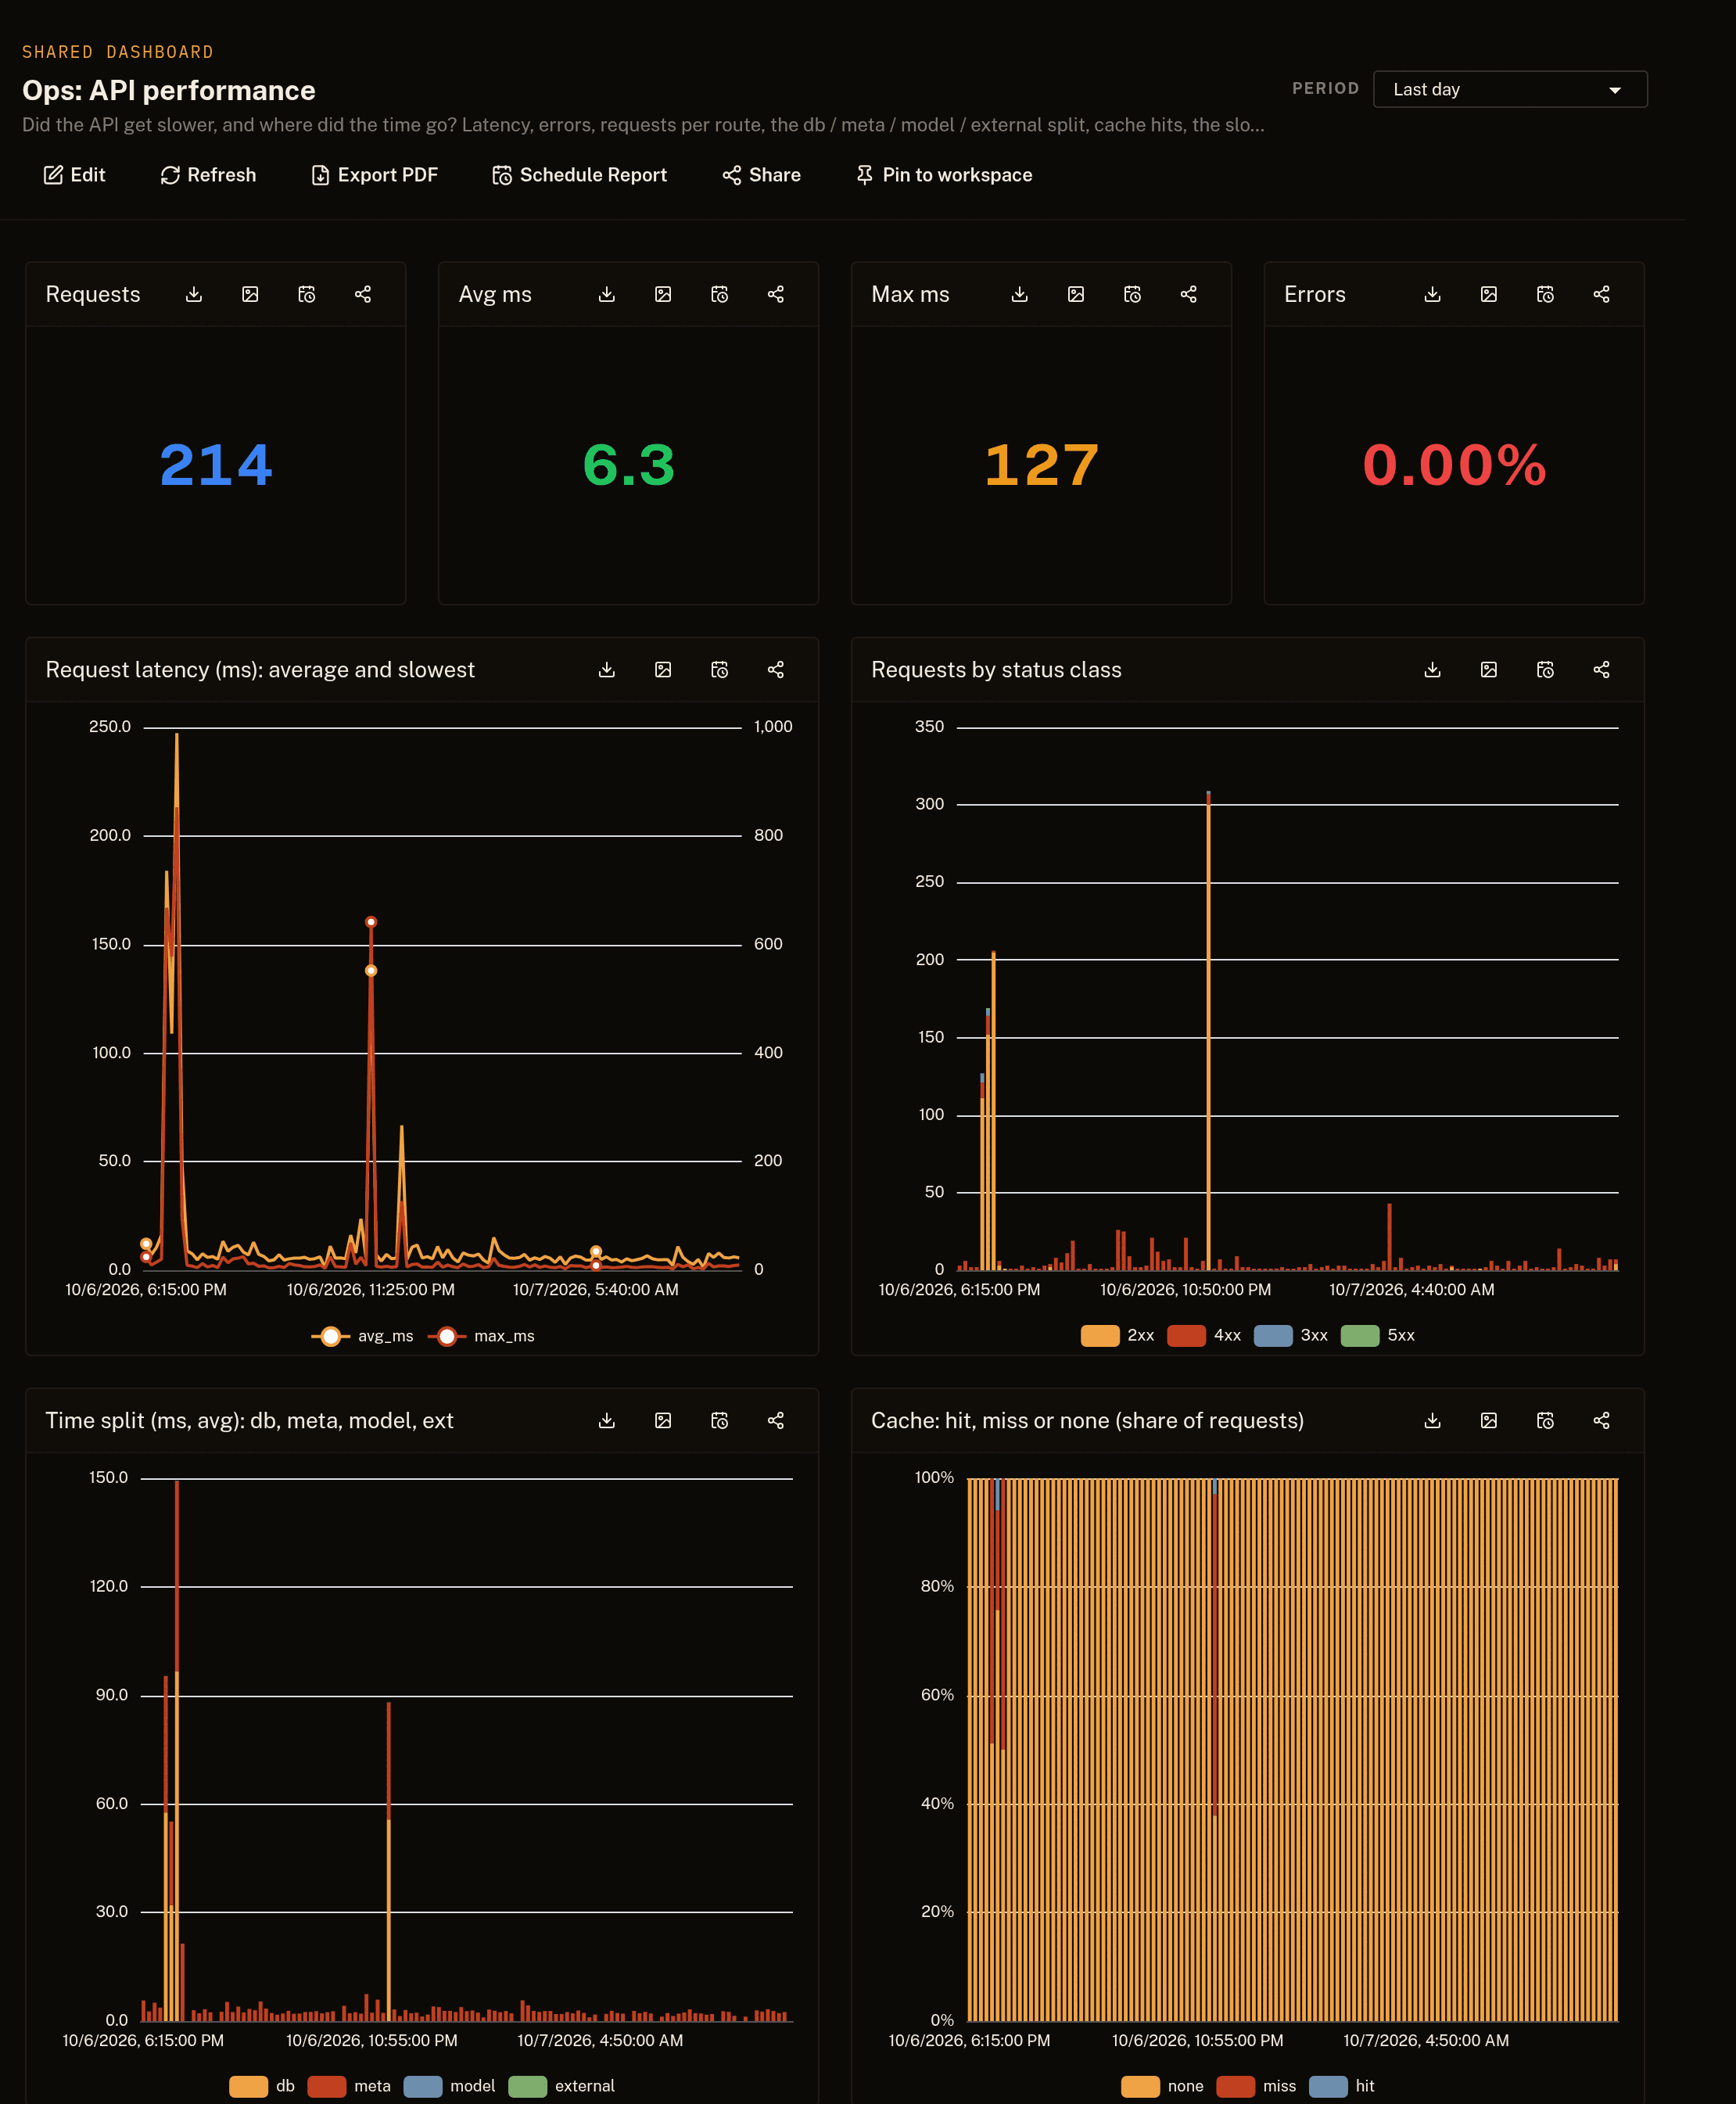
What it shows
Six dashboards and 74 widgets: machine health, containers, ClickHouse, ingestion, API performance and capacity. Two of them use the analytics the product already ships, so we can say how they behave in practice.
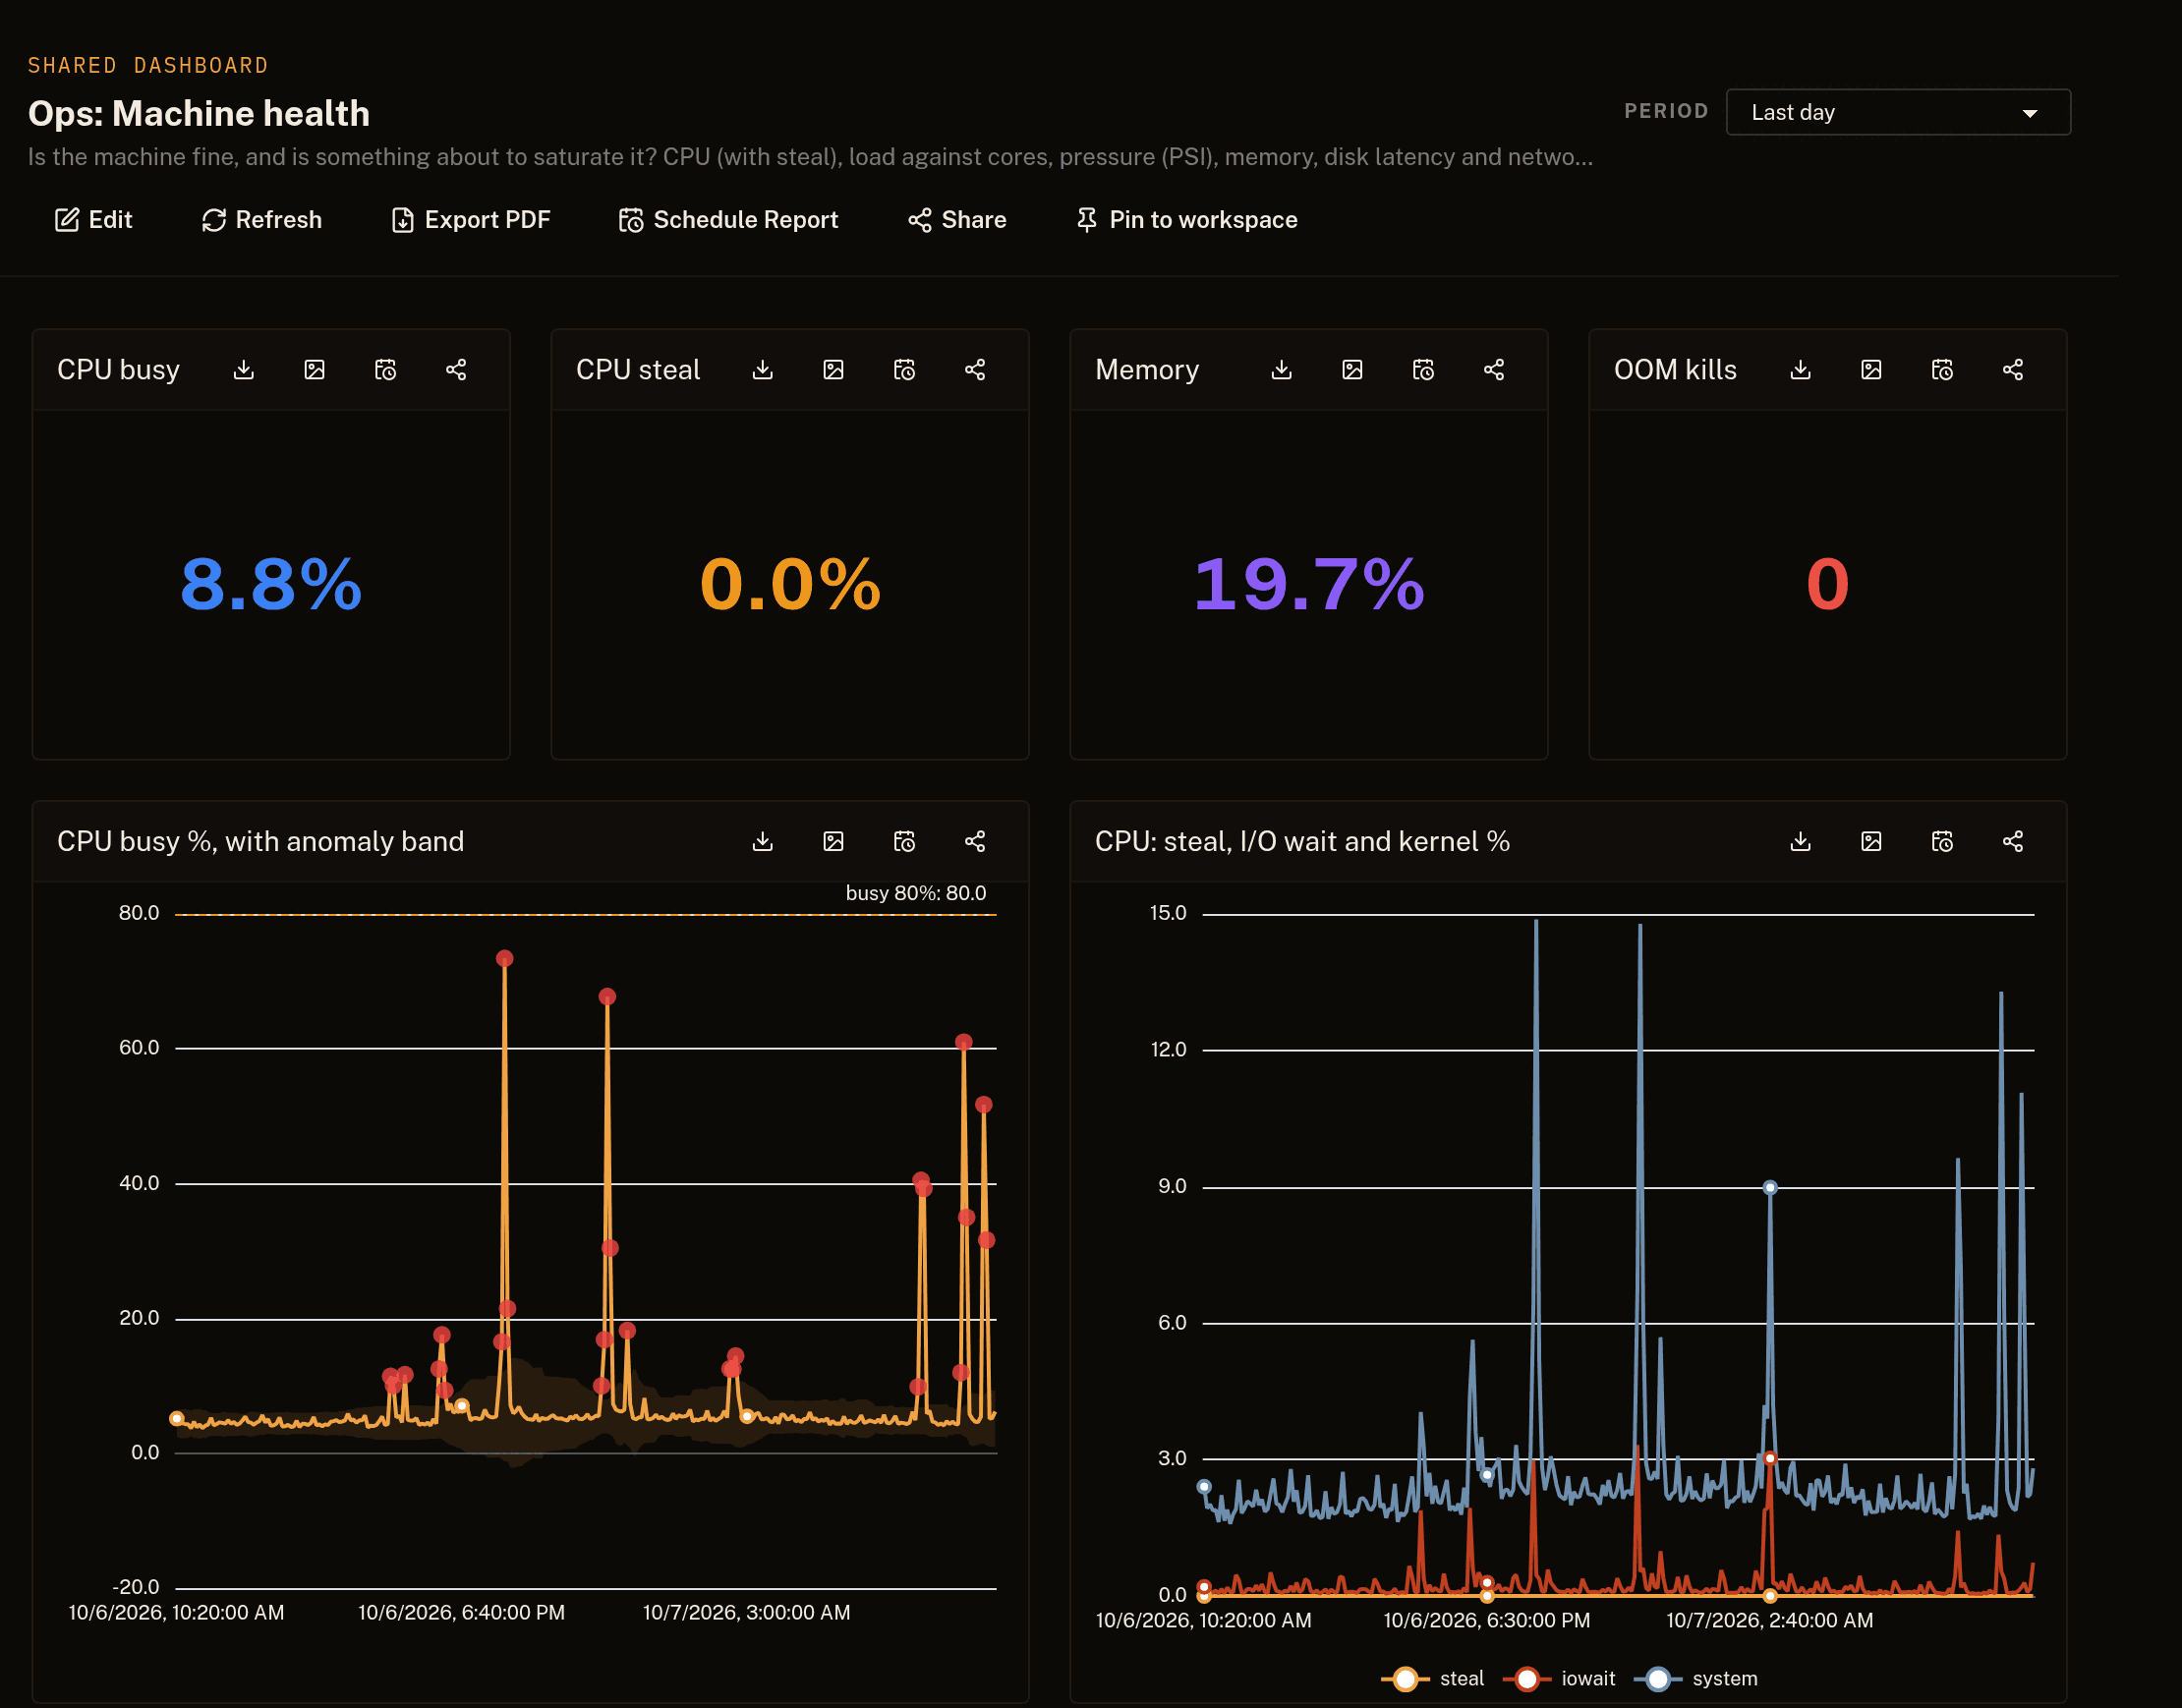
CPU carries an anomaly band, an IQR band with k of 3 over a trailing window of 48 points, so a spike is judged against the samples just before it instead of against a fixed threshold someone guessed. The capacity dashboard draws disk usage as a daily maximum with a 30 day Holt-Winters forecast, a weekly season and a 90 percent band, with the warning line at 75 and the critical line at 88 drawn across it. The day the forecast crosses the 88 line is the answer to "when does it fill", and it is a chart, not a script we have to remember to run.
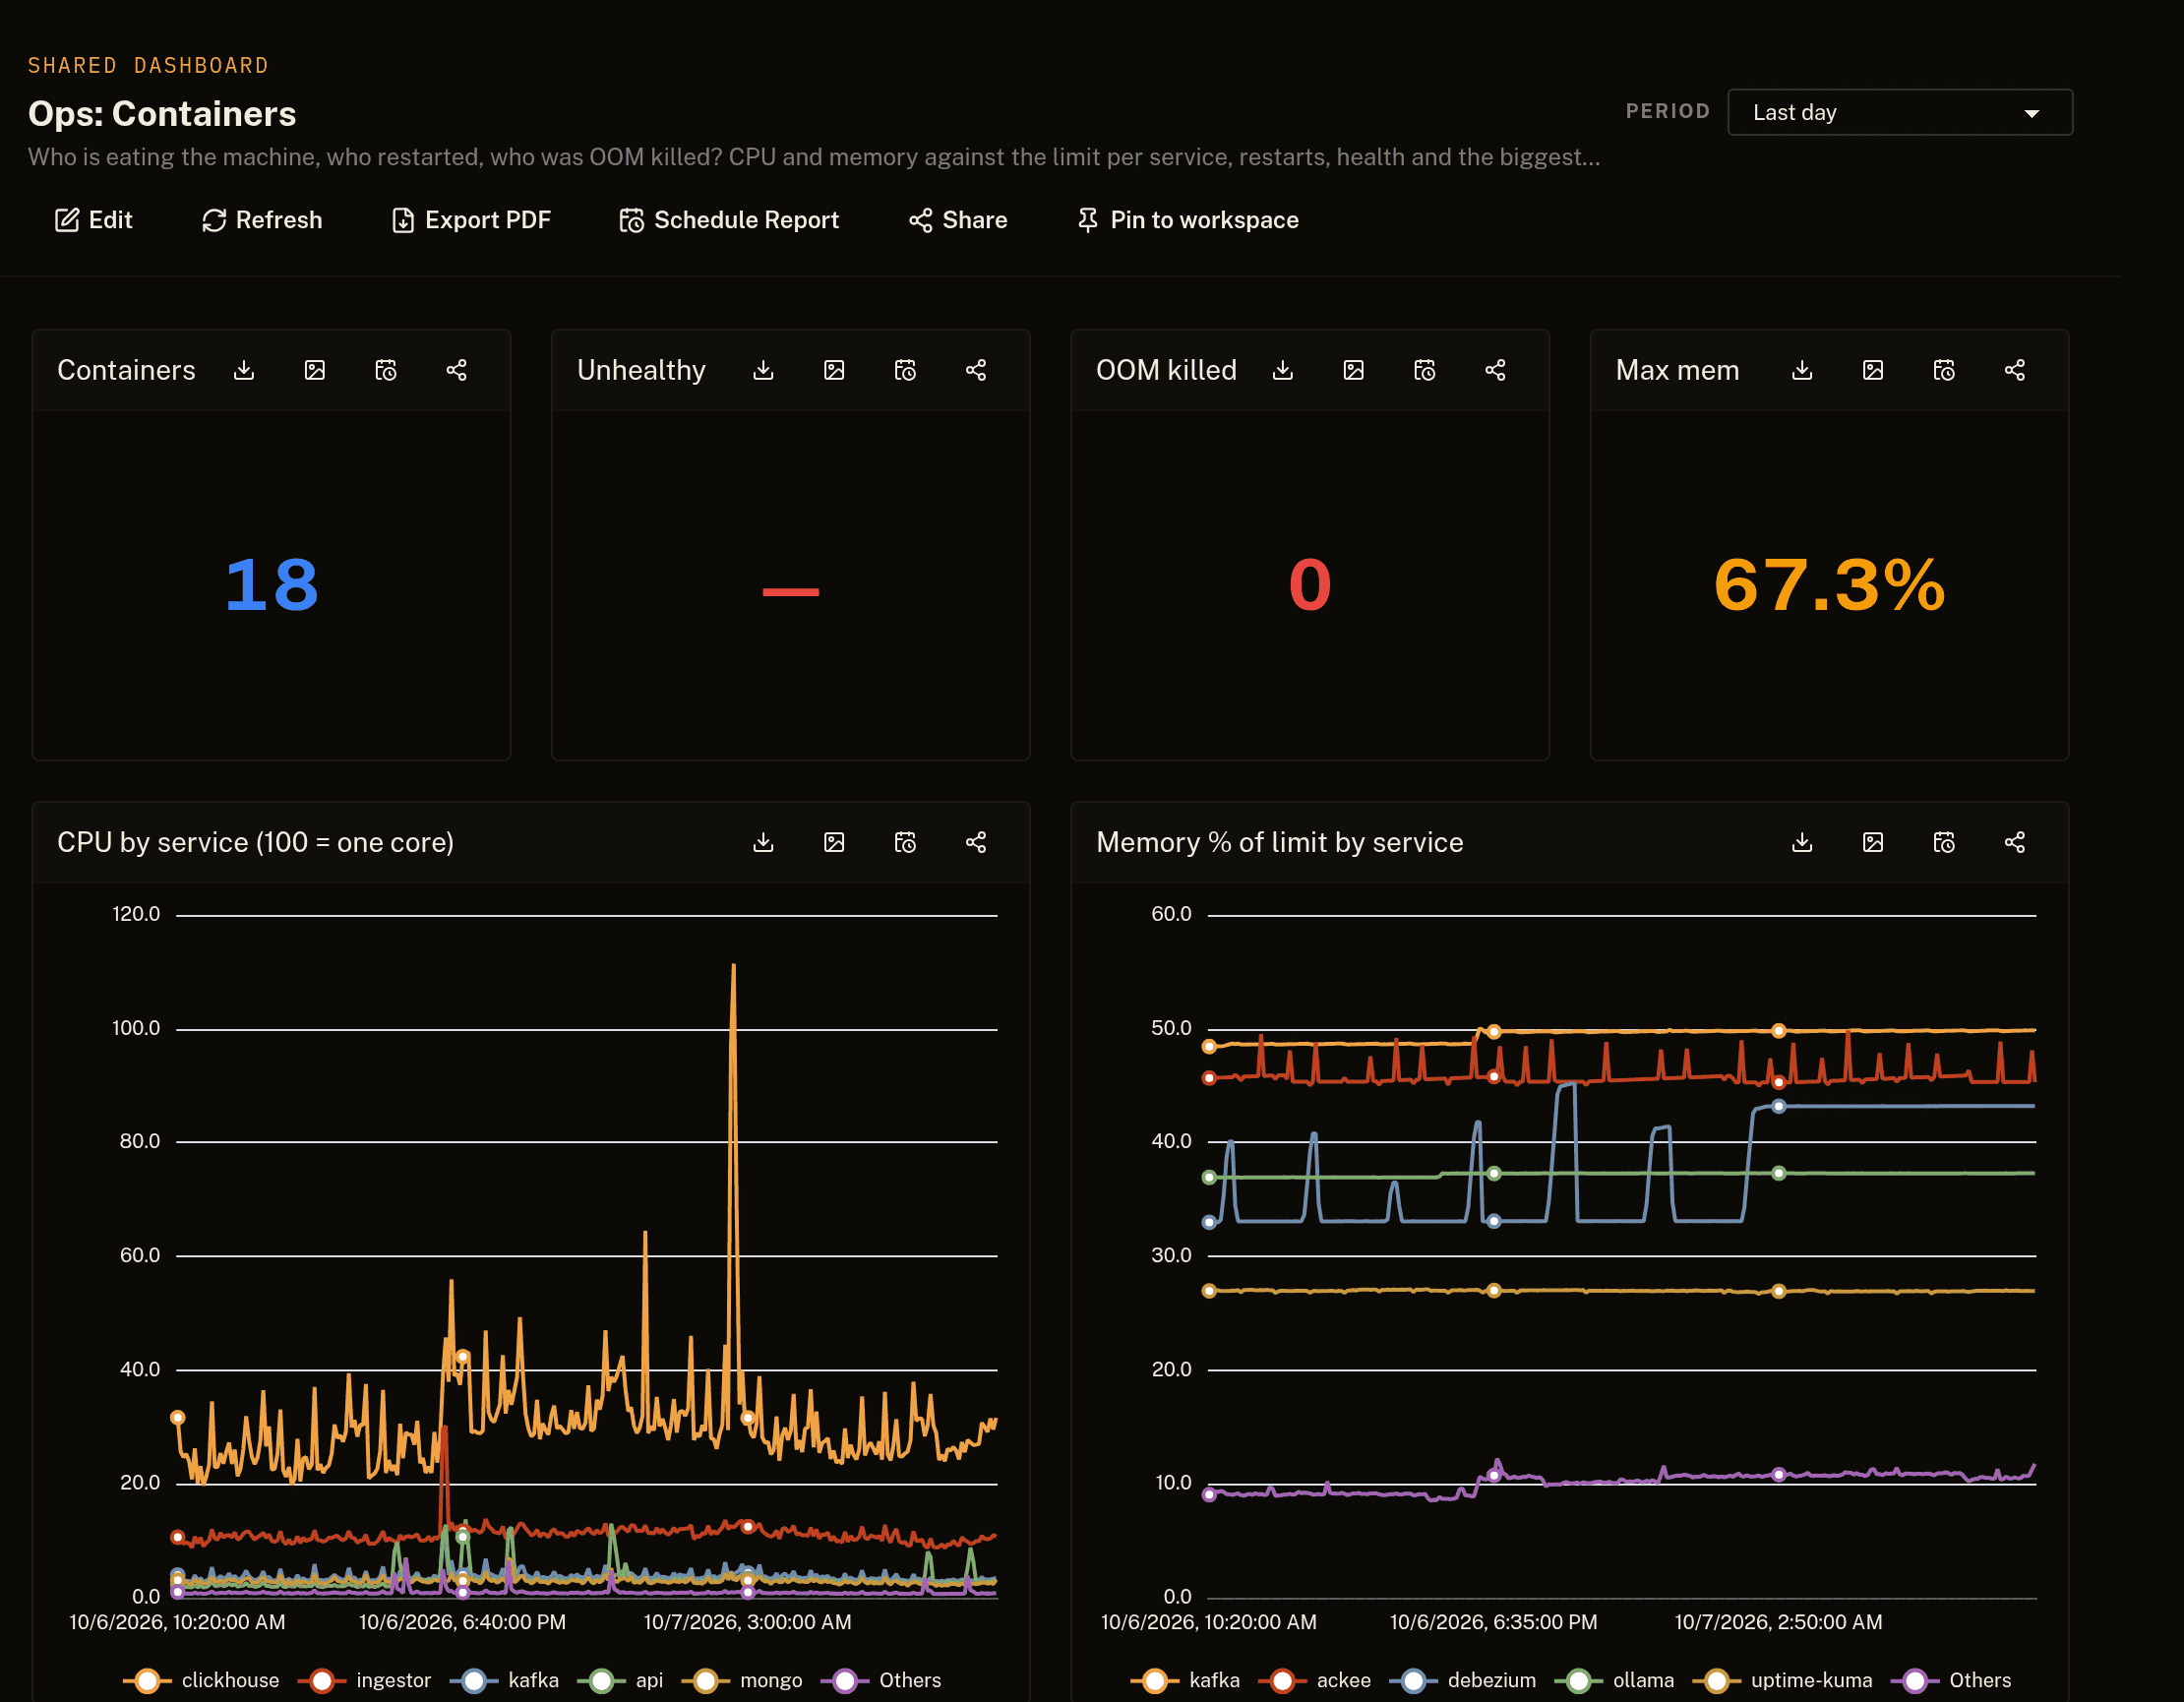
The containers dashboard answers the question that used to need SSH, who is eating the machine, with CPU and memory against the limit for each service.
Alerts are data too
The seven alerts that make sense are defined next to the dashboards: disk above 88 percent, the disk forecast crossing 88 percent within a week, a container killed for memory, restarts jumping, ClickHouse rejecting queries, API errors in the last hour, and the tracer's own event loop delay. They are created inactive and without recipients, so nothing pages anyone until its owner attaches an address.
Build the same thing
Nothing here is internal. Any file your services already write can go through the Collection Agent. Any service that speaks OpenTelemetry can send traces to the OTLP node. Anything else can post events through the JavaScript SDK. From there the anomaly bands, the forecasts and the alert rules are options on a chart, the same ones we used.
A product is easier to trust when its makers have to live inside it.